Introduction
AI has become a major source of corporate credit supply, with financing needs likely to accelerate as investment plans grow. This wave is reshaping corporate credit as unprecedented issuance reaches across issuers, sectors, and structures. Hyperscalers sit at the center, but the buildout also draws in data center operators, utilities, infrastructure platforms, and equipment suppliers across public and private markets.
The scale and pace of AI financing are testing the investor appetite for issuer and sector concentration. Investors are also weighing the risk that returns on capital expenditures (capex) fall short, or fail to arrive if external disruptors reshape the economics of the buildout. Hyperscalers remain committed to forging ahead despite higher borrowing costs, which may put further upward pressure on AI-related spreads. We do not expect that spread pressure to spill meaningfully into other sectors.
Key Takeaways
- We expect AI-driven funding needs to expand as capital investment plans scale.
- While hyperscalers sit at the center, data center operators, utilities, infrastructure platforms, and equipment suppliers are tapping public and private markets.
- The pace of AI financing is testing investor appetite for issuer and sector exposure.
- We’re monitoring the risk that returns on capital expenditures fall short.
- Recent widening in AI-related high yield spreads, particularly neocloud and single-tenant data centers, reinforces our focus on disciplined security selection.
Macroeconomic Update
Growth Remains Resilient, but Inflation Risks Linger
We see the U.S. economy expanding about 2 percent in 2026. The AI investment cycle continues to support growth even as the economy faces repeated supply shocks. Business fixed investment is on pace to grow 7–8 percent this year as AI-related capex accelerates and the broader capex incentives in the One Big Beautiful Bill Act legislation take hold. We see a stable labor market, with nonfarm payroll gains averaging 61,000 per month in 2026 and unemployment holding at 4.1 percent.
The consumer remains resilient, but spending growth should moderate as inflation weighs on incomes and temporary supports fade. Wealth effects from stock market gains and a stable labor market have been underpinning robust consumption. However, average gasoline prices have risen from under $3 per gallon to over $4.50 this year, slowing year-over-year real income growth to near zero. And, while tax refunds helped sustain spending, the fiscal boost should fade in coming months. Against this backdrop, we expect consumption growth to slow to around 2 percent in the second half of 2026.
We expect inflation to moderate in the second half of the year as energy prices settle and core services cool, but the path carries meaningful risks. Headline inflation eased in June on the quick decline in oil prices following the Iran Memorandum of Understanding, and the core Consumer Price Index showed broad-based slowing across transportation, healthcare, and cell phone services. Since then, energy prices have swung sharply on renewed Middle East tensions, a reminder that the recent improvement in headline inflation rests on a fragile geopolitical footing. A second risk to the inflation outlook is that AI capital spending continues to generate inflationary impulses in technology goods that could spill over into consumer prices as the buildout accelerates. Together they raise the risk that inflation stays stickier than our baseline projection through year end.
Energy Prices Continue to Swing Sharply on Iran Conflict
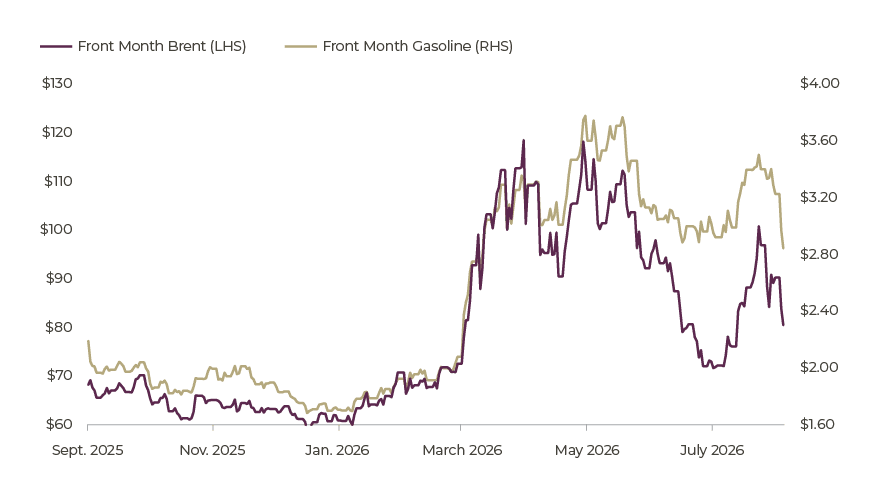
Source: Guggenheim Investments, Bloomberg. Data as of 8.4.2026.
With growth holding firm and inflation facing upside risks, the Federal Reserve (Fed) is at an inflection point as it weighs whether to tighten policy. The Fed held rates steady in July, but three dissents in favor of a 25-basis-point hike showed building concern among Federal Open Market Committee (FOMC) participants about the risk of persistent inflation. This followed June projections showing that half of the committee saw at least one hike this year. Our baseline remains that the Fed will hold rates through year end as inflation moderates, but there is upside risk to our forecast. FOMC participants’ patience with the disinflation timeline is waning, and without convincing evidence of cooling underlying inflation they may adjust rates higher to reduce the risk of inflation becoming entrenched.
Corporate Credit Review
Macroeconomic Forces Shaped Credit Performance in the First Half of 2026
Corporate credit spreads are modestly wider year to date, with index-level moves masking divergences across sectors and issuers as heavy new issuance and AI-driven disruption create both risks and opportunities beneath the surface.
The AI signal shows up differently across cohorts. Among investment-grade hyperscalers, wider spreads reflect the market absorbing supply and have created attractive entry points, especially in transactions with more innovative structures, even as they weighed on excess returns in the technology sector year to date. In high yield, AI-related spreads have widened for a distinct reason: with more leveraged balance sheets and less clarity on where economic value in the buildout ultimately accrues, investors are pricing greater uncertainty, not just heavier supply. Wider spreads for bank loans, on the other hand, reflect concerns over business disruption rather than issuance. Technology is the only sector with negative year-to-date returns, reflecting software companies’ exposure to enterprise technology budgets being redirected toward AI infrastructure. Performance bounced in July, but that budget shift remains a key forward risk for the cohort.
Dispersion in Excess Returns Highlights War and Tech Drivers this Year
Corporate Bond Market Excess Returns by Industry

Source: Guggenheim Investments, Bloomberg. Data as of 8.5.2026.
Energy is the standout of 2026 sector performance, delivering nearly 4 percent excess return year to date in high yield and about 1.2 percent in investment grade on higher post-Iran conflict oil prices and robust earnings momentum. Analyst forecasts for 2026 call for 72 percent earnings per share growth for large caps and 44 percent for small caps. In contrast, transportation sectors have lagged on the same fuel-cost move.
AI Is Reshaping the Structure of Corporate Credit
Record issuance has become a defining cross-market theme as new borrowers and financing structures emerge. Gross issuance across corporate debt and loan markets reached $1.8 trillion in the first half and could approach $3.2 trillion for 2026 overall at the current pace, well above the previous annual record of $2.8 trillion in 2021. The increase is largely an investment-grade story, with issuance on pace to exceed $2 trillion in 2026 and nearly all of the growth versus 2025 driven by AI-related borrowers.
Corporate Credit Issuance on Track for a New Record
1H26 Gross Issuance Volume
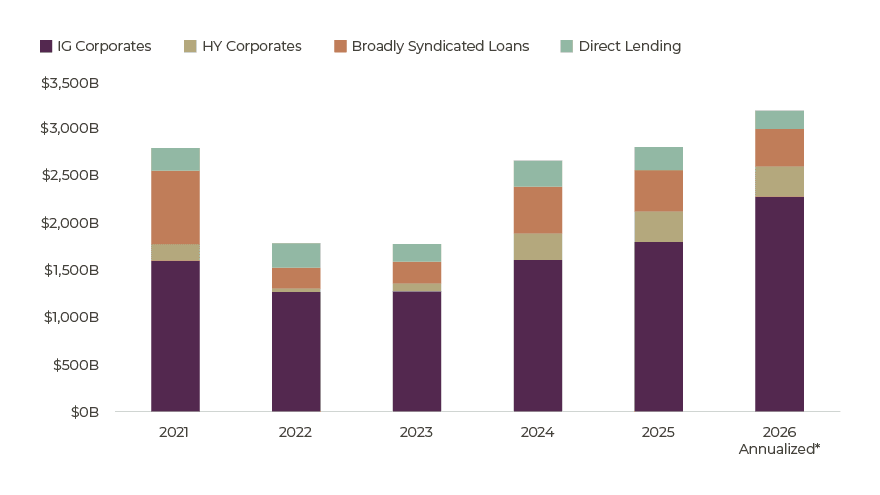
Source: Guggenheim Investments, Morgan Stanley, Pitchbook/LCD. Data as of 6.30.2026. 2026 figure is 1H26 annualized with some seasonality for August and December.
No single credit sector can fully absorb the scale and speed of AI financing needs, so issuers are spreading the buildout across multiple channels. Individual transactions increasingly blend project finance, structured credit, private lending, and traditional corporate debt, while the buildout also pulls large volumes of conventional financing into adjacent sectors such as power and grid infrastructure. These flows reach pockets of capital that legacy formats could not. A few examples this year illustrate the pattern.
- Data center bonds in IG and HY corporate markets. Investment-grade-rated real estate investment trusts and operators are issuing unsecured bonds and project debt backed by long-term hyperscaler contracts. Sub-investment-grade operators and neocloud providers have issued $39 billion of high yield bonds secured by data center assets and supported by major cloud leases.
- Chip financing structures. Special purpose vehicles are borrowing to purchase graphics processing units (GPUs) and other AI accelerators, with contracted revenue and claims on the chips themselves providing lenders with security—a structure that attracts capital pools traditional corporate and equipment-finance markets do not.
- Joint venture and asset-level financings. Hyperscalers are partnering with asset managers and infrastructure investors to finance data centers through separate entities, with debt secured by the physical asset and long-term offtake contracts. Investors get direct exposure to contracted infrastructure; hyperscalers secure capacity with off balance sheet debt.
- Power generation and grid financing. Utilities in major data-center markets are expanding capacity to meet rising electricity demand, funded through debt and equity as part of broader capital plans. The AI-attributable share is difficult to isolate, but signed data-center contracts visibly lifting investment plans.
Hyperscalers sit at the center as the largest direct issuers, as well as tenants or offtake counterparties across these other structures. Their $157 billion of U.S. investment-grade issuance year to date, alongside about $60 billion of foreign-currency debt, is the largest change in net investment-grade supply from last year—a dynamic we expect to continue.
Hyperscaler 1H26 Supply Already Exceeds 2025 Issuance
Total Hyperscaler USD-Denominated Corporate Bond Issuance
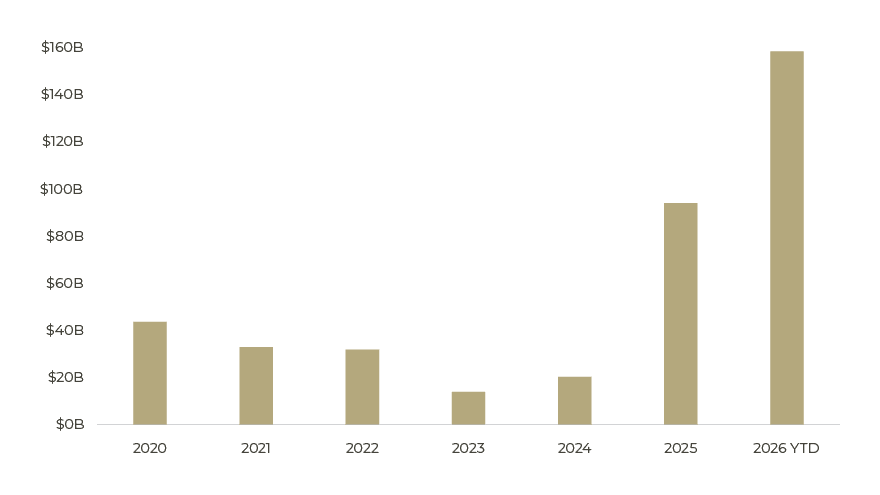
Source: Guggenheim Investments, Bloomberg. Data as of 8.10.2026. Includes USD-Denominated issuance by Microsoft, Oracle, Meta, Google and Amazon.
Investors Seek Greater Compensation for Thematic Exposure
Rising supply, alongside concerns about return on investment, lifted the spreads that investors require to take additional AI credit risk in July. Amazon’s multi-tranche July issuance pushed long-dated AI-related issuer spreads roughly 8–12 basis points wider on the day of pricing, well beyond the market’s reaction to its March issue.
Amazon’s July Deal Revealed Growing Pressure Across AI Credit
Change in Long-dated spreads on AMZN issuance days
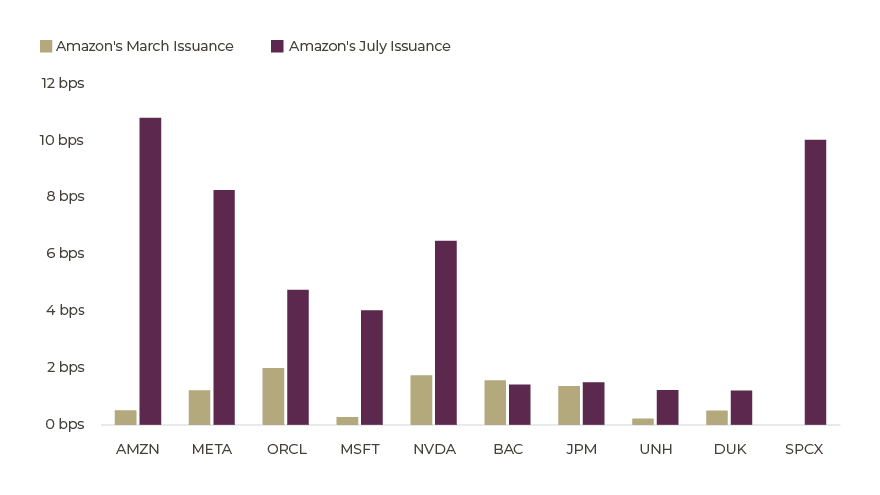
Source: Guggenheim Investments, Bloomberg. Data as of 7.31.2026.
Hyperscaler Bonds Have Widened With Limited Spillover to the Investment Grade Index
IG Corporate Bond Spreads
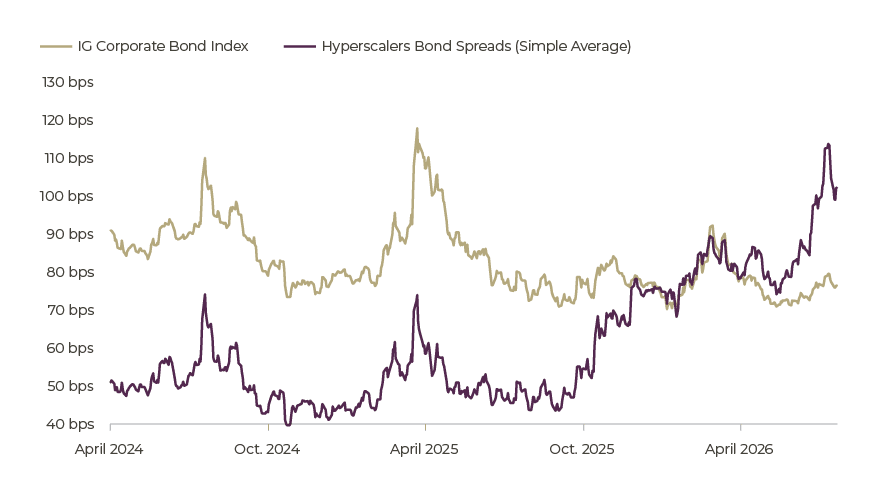
Source: Guggenheim Investments, Bloomberg. Data as of 8.7.2026.
The scale and long duration of this issuance have made AI one of the largest thematic spread exposures in the market. In investment grade, tech bonds and hyperscalers now represent roughly 21 percent of the 10-year-plus investment-grade index by par value outstanding, rivaling the banking sector. Their unusually long duration gives the cohort an even larger share of duration-times-spread risk—each sector’s contribution to overall portfolio spread sensitivity—in the Bloomberg U.S. Corporate Index. In high yield, AI-related bonds are only 4 percent of the Bloomberg U.S. High Yield Corporate Bond Index but 40 percent of net new issuance in 2026.
Hyperscaler Bonds Contributed a Lot to IG Portfolio Risk
Contribution to IG Corporate Index Duration Times Spread
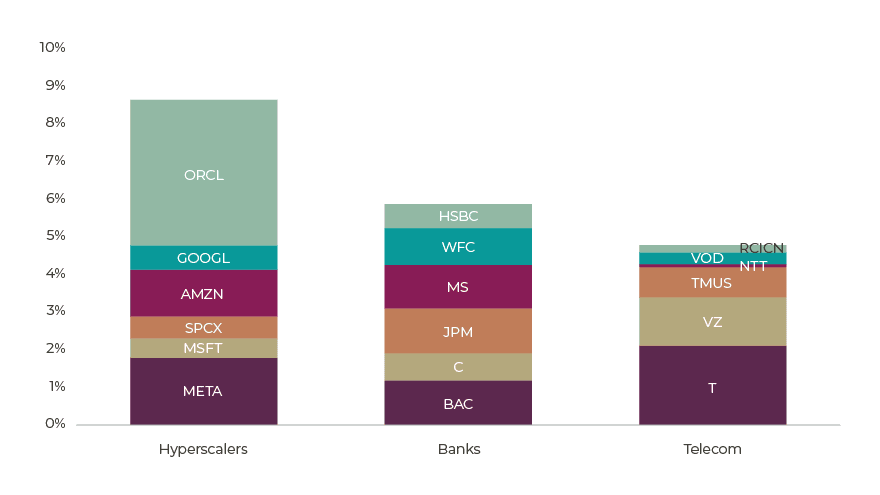
Source: Guggenheim Investments, Bloomberg. Data as of 7.25.2026. Duration Times Spread (DTS), calculated as a bond’s spread duration multiplied by its option-adjusted spread, estimates how sensitive a portfolio is to proportional changes in credit spreads and is a simplified measure that does not account for default risk or other complex price movements.
High Yield AI Spreads Widen on Growing Concerns Surrounding Return on Investment
High Yield Bond Spreads
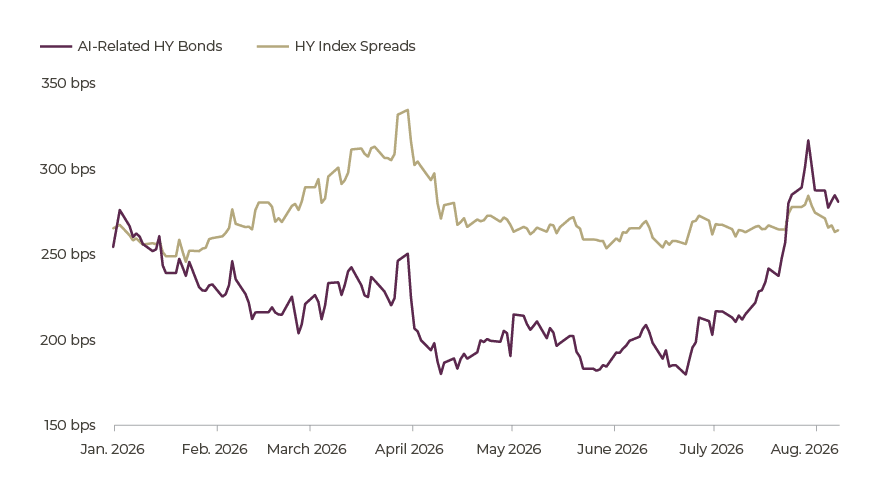
Source: Guggenheim Investments, Bloomberg. Data as of 8.7.2026.
Investors are increasingly differentiating among credits based on balance sheet strength and perceived ability to monetize the rising costs of the AI buildout. The tight supply of GPUs and memory has handed chip and component producers meaningful pricing power, and hyperscalers and neoclouds are paying a premium to secure capacity in a market where demand is running well ahead of supply. Most hyperscalers have strong balance sheets and a broad base of compute customers. However, for some, spending plans could look excessive if efficient open source models reduce the compute intensity of AI workloads over time. The high yield market is already sorting along those lines. Active managers with experience in complex, asset-backed structures are able to understand these dynamics to try and pick winners and losers.
Supply Wave Has Further to Run
We expect hyperscalers to push ahead with buildout plans even as input and financing costs rise. They have shown willingness to pay the required concessions, and only a sharp deterioration in their return outlook or a major economic disruption would meaningfully shift their strategy. Sustained issuance from this concentrated group should continue to drive decompression and curve steepening in long-dated tech credit.
Under current median analyst estimates, hyperscalers may need to raise $220 billion through 2027—with only about $30 billion of need remaining this year and the balance in 2027 as operating cash flow is absorbed by estimated capex and other cash needs. Issuers are unlikely to wait until 2027, suggesting further supply in the second half of 2026. And if the recent pattern of upward capex revisions continues, funding needs will grow: A 20 percent lift to 2027 capex could push cumulative funding needs closer to $400 billion, with the incremental spend flowing entirely to external funding needs.
Traditional leverage metrics suggest room to borrow, with most hyperscalers carrying debt-to-earnings before interest, taxes, depreciation, and amortization figures well under 2x. But off-balance sheet financing is complicating the picture. Leases, capacity agreements, joint ventures, and project-level financings add exposure beyond what the balance sheet shows, and there is no settled framework for how investors should treat these obligations when assessing effective leverage. This ambiguity is likely to push more of the funding into alternative channels alongside traditional debt.
Equity has become a more visible piece of the mix to preserve capacity for future debt issuance, but its use requires careful trade-offs. Rising dilution costs are pushing companies to redirect internally generated cash. Share repurchases have already declined, and dividend growth will likely moderate if funding needs keep rising.
Investment Takeaways
- Strong fundamentals may not prevent hyperscaler bonds from underperforming. Heavy issuance, portfolio concentration, and growing scrutiny of returns on AI capex should continue to pressure AI-related spreads relative to Treasurys and other investment-grade sectors.
- Barring an external shock, AI-related issuance should remain robust in the months ahead. We do not expect the resulting pressure to spill broadly to other sectors given supportive corporate fundamentals and strong demand from investors seeking yield and diversification, though selectivity is warranted within AI-exposed credit as the market differentiates by tenant and position in the buildout.
- Off-balance sheet financing vehicles can offer attractive opportunities given the concessions available on new transactions. We would find value here when spreads adequately compensate investors for asset, counterparty, contractual, and structural risks. The complexity of these deals, combined with the evolving view of where economic value ultimately accrues, makes active underwriting essential.
- High yield bonds continue to offer attractive income, but historically tight spreads create an asymmetric return outlook. Recent widening in AI-related high yield bonds highlights the case for selectivity, particularly around neocloud and single-tenant data center exposures.
Corporate Credit Market Performance
Corporate credit fundamentals remain broadly stable, but year-to-date total returns reflect mixed impact from the move higher in Treasury yields, with the 5-year and 10-year notes up 72 basis points and 57 basis points since year-end 2025, respectively. The investment-grade sector has been the most impacted by this given its longer-duration profile, pushing returns into modestly negative territory. In contrast, high yield corporates and bank loans have been supported by shorter duration and the cushion of carry, with CCC loans the exception on lingering default concerns. We think the income embedded across the market remains a meaningful buffer as rate volatility settles. Importantly, dispersion has widened in ways that reward active positioning. Heavy AI issuance has widened tech spreads. Energy has performed well amid higher oil prices. Some bank loan sectors have outperformed on limited rate exposure, while underwriting discipline remains warranted in the lower quality tail.
Corporate Credit Performance Statistics

Source: Guggenheim Investments, Bloomberg, S&P CreditPro, S&P Dow Jones Indices, UBS. Yields, Spreads, and total returns as of 7.31.2026. Corporate bond yields are yield to worst, bank loan yields are 3-year yields, which assumes the loan is repaid or refinanced in 3 years. Net rating migration and default rates as both issuer-weighted and as of 6.30.2026. Net rating migration is calculated as the share of instruments in each sector rated by S&P that were upgraded minus the share of instruments that were downgraded.
Investment-Grade and High Yield Corporate Bond Spreads and Bank Loan Discount Margins
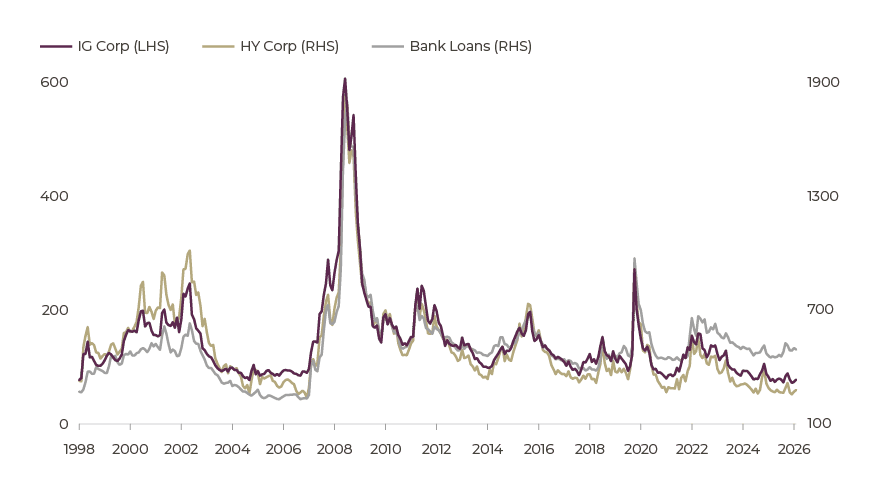
Historical Spreads and Yields in Percentiles Since 2000
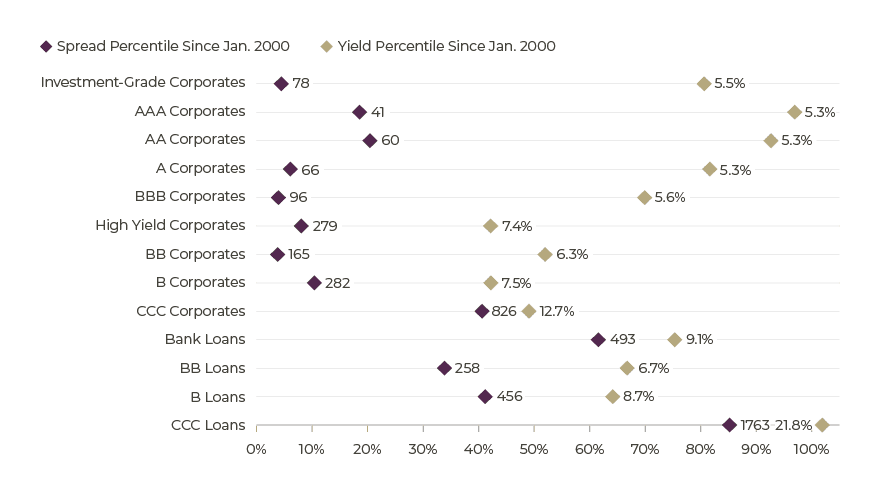
Source: Guggenheim Investments, Bloomberg, S&P Dow Jones Indices, UBS. Data as of 7.31.2026. Left and right axes are truncated to enhance visibility of recent spread movement. A low percentile means spreads are tight/yields are low and a high percentile means spreads are wide/yields are high relative to history. Past performance does not guarantee future results.
Important Notices and Disclosures
The referenced indexes are unmanaged and not available for direct investment. Index performance does not reflect transaction costs, fees or expenses.
The S&P UBS Leveraged Loan Index tracks the investable market of the U.S. dollar denominated leveraged loan market. It consists of issues rated “5B” or lower, meaning that the highest rated issues included in this index are Moody’s/S&P ratings of Baa1/BB+ or Ba1/ BBB+. All loans are funded term loans with a tenor of at least one year and are made by issuers domiciled in developed countries.
The ICE BofA U.S. High Yield Index tracks the performance of U.S. dollar denominated below investment grade corporate debt publicly issued in the U.S. domestic market. Qualifying securities must have a below investment grade rating (based on an average of Moody’s, S&P and Fitch), at least 18 months to final maturity at the time of issuance, at least one year remaining term to final maturity as of the rebalancing date, a fixed coupon schedule and a minimum amount outstanding of $250 million. In addition, qualifying securities must have risk exposure to countries that are members of the FX-G10, Western Europe or territories of the United States and Western Europe. The FX-G10 includes all Euro members, the United States, Japan, the United Kingdom, Canada, Australia, New Zealand, Switzerland, Norway, and Sweden.
AAA is the highest possible rating for a bond. Bonds rated BBB or higher are considered investment grade. BB, B, and CCC-rated bonds are considered below investment grade and carry a higher risk of default, but offer higher return potential. A split bond rating occurs when rating agencies differ in their assessment of a bond.
A basis point (bps) is a unit of measure used to describe the percentage change in the value or rate of an instrument. One basis point is equivalent to 0.01 percent.
Carry is the difference between the cost of financing an asset and the interest received on that asset.
The three-year discount margin to maturity (DMM), also referred to as discount margin, is the yield-to-refunding of a loan facility less the current three-month Libor rate, assuming a three year average life for the loan.
Dry powder refers to highly liquid assets, such as cash or money market instruments, that can be invested when more attractive investment opportunities arise.
EBITDA stands for earnings before interest, taxes, depreciation, and amortization.
Hyperscalers are large-scale cloud service providers that offer computing and storage at enterprise scale.
The interest coverage ratio is a debt and profitability ratio used to determine how easily a company can pay interest on its outstanding debt.
The leverage ratio is a metric that expresses how much of a company’s operations or assets are financed with borrowed money.
Spread is the difference in yield to a Treasury bond of comparable maturity.
Investing involves risk, including the possible loss of principal. In general, the value of a fixed-income security falls when interest rates rise and rises when interest rates fall. Longer term bonds are more sensitive to interest rate changes and subject to greater volatility than those with shorter maturities. During periods of declining rates, the interest rates on floating rate securities generally reset downward and their value is unlikely to rise to the same extent as comparable fixed rate securities. High yield and unrated debt securities are at a greater risk of default than investment grade bonds and may be less liquid, which may increase volatility. Investors in asset-backed securities, including mortgage-backed securities and collateralized loan obligations (CLOs), generally receive payments that are part interest and part return of principal. These payments may vary based on the rate loans are repaid. Some asset-backed securities may have structures that make their reaction to interest rates and other factors difficult to predict, making their prices volatile and they are subject to liquidity and valuation risk. CLOs bear similar risks to investing in loans directly, such as credit, interest rate, counterparty, prepayment, liquidity, and valuation risks. Loans are often below investment grade, may be unrated, and typically offer a fixed or floating interest rate. Private credit investments are generally considered illiquid and not quoted on any exchange; thus they are difficult to value. The process of valuing investments for which reliable market quotations are not available is based on inherent uncertainties and may not be accurate. Further, the level of discretion used by an investment manager to value private credit securities could lead to conflicts of interest.
This article is distributed for informational or educational purposes only and should not be considered a recommendation of any particular security, strategy or investment product, or as investing advice of any kind. This article is not provided in a fiduciary capacity, may not be relied upon for or in connection with the making of investment decisions, and does not constitute a solicitation of an offer to buy or sell securities. The content contained herein is not intended to be and should not be construed as legal or tax advice and/or a legal opinion. Always consult a financial, tax and/or legal professional regarding your specific situation.
This article contains opinions of the author but not necessarily those of Guggenheim Partners or its subsidiaries. The author’s opinions are subject to change without notice. Forward-looking statements, estimates, and certain information contained herein are based upon proprietary and non-proprietary research and other sources. Information contained herein has been obtained from sources believed to be reliable, but are not assured as to accuracy. No part of this article may be reproduced in any form, or referred to in any other publication, without express written permission of Guggenheim Partners, LLC. Past performance is not indicative of future results. There is neither representation nor warranty as to the current accuracy of, nor liability for, decisions based on such information.
NOT FDIC INSURED | NOT BANK GUARANTEED | MAY LOSE VALUE
©2026, Guggenheim Partners, LLC. No part of this article may be reproduced in any form, or referred to in any other publication, without express written permission of Guggenheim Partners, LLC. Guggenheim Funds Distributors, LLC is an affiliate of Guggenheim Partners, LLC. For information, call 800.345.7999 or 800.820.0888.
5835417