Structured Credit Outlook
Third Quarter 2026
Volatility has returned to global markets, but as we expected, structured credit has been mostly insulated and has performed well. Rising interest rates and the Iran conflict have intermittently tempered investor risk appetite. Despite this backdrop, issuance remains healthy, and credit spreads have generally tightened and remain stable. These conditions reflect solid fundamentals and healthy technicals given continued strong investor demand.
Beneath this pricing stability, credit quality dispersion across the structured credit spectrum is growing, especially within commercial real estate and in more credit sensitive mezzanine positions across other sectors including consumer and corporate loans. Differences across deal structures, collateral pools, and sponsor business quality are starting to emerge as the cycle matures, reinforcing the importance of credit selectivity over the intermediate term.
In this edition, we focus on one of our highest conviction allocations: non-Agency residential mortgage-backed securities (RMBS). Strong borrower fundamentals, improved structural protections, attractive relative valuations, and favorable optionality profiles distinguish the sector from both Agency MBS and investment-grade corporates.
Highlights
- Strong fundamentals, improved structures, and attractive valuations make high quality non-Agency RMBS among the most compelling opportunities in structured credit, offering spread pickup over both corporates and Agency MBS while offering less negative convexity than Agency MBS.
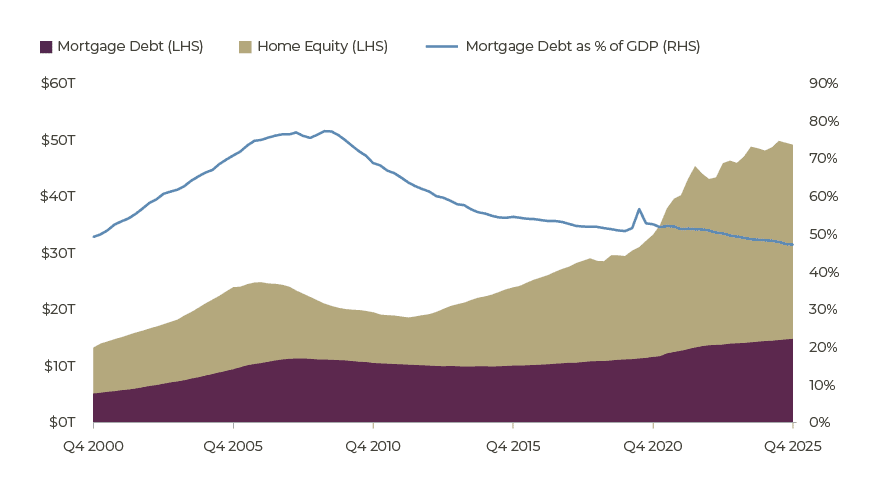
- Homeowner equity has grown to 2.3x mortgage debt, roughly double the low reached during the Global Financial Crisis (GFC), providing a substantial cushion against home price declines. Conservative post-crisis underwriting and limited housing supply provide a floor on real estate values.
- Market technicals may create attractive entry points. Fragmented non-qualified mortgage (non-QM) origination and elevated 2026 supply could strain syndication capacity and provide a limit on additional issuance, thereby dampening supply overhang in a lower mortgage rate scenario.
- We favor investment-grade tranches backed by non-QM and closed-end second collateral for their shorter duration and loss remoteness. We remain cautious on prime jumbo deals given their higher callability, and deeply subordinated tranches, which are more volatile and exposed to collateral idiosyncrasies.
Macroeconomic Update
We Expect the Fed to Remain on Hold into 2027
The U.S. economy enters the second half of 2026 with a steady baseline outlook, but narrow growth drivers and persistent inflation present substantial risks. The economy has so far weathered a historic energy supply disruption, with tax refunds cushioning consumers from higher energy prices, and AI capex also driving growth. Looking ahead, we expect real gross domestic product (GDP) growth of approximately 2.0 percent in 2026, with a similar pace in 2027. While fiscal support for consumers will fade in coming months, a steadier labor market should help support consumer spending, while upper income consumers in particular continue to benefit from strong wealth gains.
Inflation remains well above the Federal Reserve’s (Fed) 2 percent target, with core personal consumption expenditures (PCE) inflation at 3.3 percent in the 12 months through June. We expect annual readings will remain above 3 percent for the balance of the year, but sequential monthly prints in coming months should be cooler than at the start of the year. Tariff effects look to have mostly run their course, and some excess seasonality in the inflation data should help monthly prints moderate. However, lingering supply chain disruptions from the Iran conflict could cause some stickiness in inflation, and AI-related technology goods inflation is a new inflationary impulse that has had a notable impact on consumer prices this year. While we expect some moderation in the pace of technology goods inflation, helped by upcoming methodology revisions, this source of inflation poses upside risks.
At the Federal Open Market Committee’s July meeting, the Committee held rates steady, although three members signaled a desire to raise rates. We expect coming inflation prints should be just low enough to avoid hikes this fall, but rate hike risks are elevated if inflation proves persistent. Even if the Fed decides to raise rates, this would likely be a very abbreviated hiking cycle with only a few adjustments, which should allow interest rates across the curve to remain in their established ranges. We will be watching to see if AI-related investment continues to buoy tech-related components, and if the renewed rise in energy prices creates broader spillovers into core inflation.
Structured Credit Review
Structured Credit on Solid Footing
Structured credit markets have been very stable on the year with credit spreads now below historical averages. Issuance across most structured credit sectors has grown: asset-backed securities (ABS) are being driven by digital infrastructure, commercial MBS (CMBS) by large single loan deals, and RMBS by multiple emerging non-GSE conforming loan types. On the other hand, collateralized loan obligations (CLO) issuance has slowed amid emerging industry-specific credit concerns around tech/software, redemptions from certain investment products like BDCs and less favorable asset/liability arbitrage conditions for broadly syndicated CLOs. ABS, CMBS, RMBS, and CLOs have seen issuance to date of $137 billion (up 22 percent year over year), $99 billion (up 33 percent), $82 billion (up 22 percent), and $55 billion (down 22 percent), respectively.
Even at today’s historically low credit spreads, structured credit offers 50–150 basis points of pickup over duration-matched investment-grade corporates and yields of 5.5–7.5 percent for AAA-BBB rated tranches. We see the most attractive opportunities where higher spreads can be earned with stronger structural protections and collateral quality that reduce dependence on long-term asset value, contractual renewals, or business execution—a profile that characterizes many commercial ABS sectors as well as non-Agency RMBS.
Non-Agency RMBS: A High Conviction Opportunity
Non-Agency RMBS stands out in this environment. Strong fundamentals, improved structural safeguards, attractive relative valuations, and favorable optionality profiles make the sector one of our highest conviction fixed-income allocations. Market technicals reinforce the case: elevated supply from a fragmented originator base of small lenders, combined with market syndication constraints, should provide a ceiling on supply and associated spread widening pressures in lower mortgage rate scenarios. In addition, the January government-sponsored enterprise (GSE) directive to purchase $200 billion in Agency MBS has effectively established a soft backstop on Agency MBS spreads, which in turn will also remove some downside tail risk in the non-Agency RMBS market.
Since the GFC, the sector has fundamentally transformed. Today it totals roughly $750 billion—a meaningful share of the $3.3 trillion U.S. structured credit market, with non-QM, prime jumbo, and home equity products driving continued issuance growth.
Ratio of Homeowner Equity Has Quadrupled Relative to Mortgage Debt Since the GFC
Mortgage Debt, Home Equity, and Mortgage Debt as a Percentage of GDP Since December 2000
Source: Guggenheim Investments, Bloomberg. Data as of 12.31.2025. GDP = gross domestic product.
Source: Guggenheim Investments, Bloomberg . Data as of 12.31.2025. GDP = gross domestic product.
Stronger Homeowner Balance Sheets Support Mortgage Credit
The case for RMBS begins with the borrower. U.S. home prices have more than doubled over the past decade, driven by persistent housing undersupply and a mortgage rate environment that, until recently, enabled aggressive equity building. Post-GFC underwriting reforms further strengthened loan quality. The result: homeowner equity now totals 2.3x outstanding mortgage debt, roughly triple the low ratio reached during the GFC.
This equity cushion provides substantial loss protection as significant home price declines would be required before the mortgage loans would bear losses sufficient to impair investment-grade tranches. Normally, higher equity would be associated with an increased propensity for borrowers to refinance, but in today’s higher mortgage rate world, homeowners are more likely to take out a second lien to extract equity while leaving the first mortgage in place, thereby suppressing prepayments and call risk.
In addition, non-Agency RMBS borrowers skew toward the higher income cohort of the population with better credit scores and less sensitivity to the stresses emerging in consumer credit where their lower income cohorts are bearing the brunt of elevated rates and reduced fiscal support.
Affordability constraints may cap near-term home price appreciation, but the combination of strong borrower balance sheets and structural disincentives to prepay creates a favorable environment for mortgage credit.
Non-QM Investors Can Target Yield, Spread, and Credit Enhancement Levels
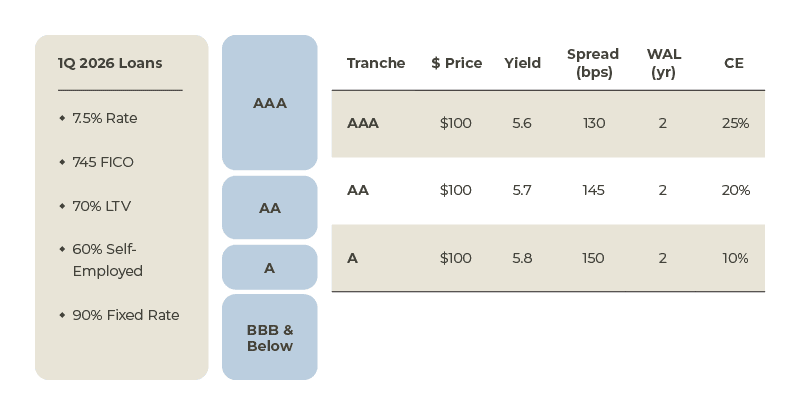
Example for hypothetical purposes only. Source: Guggenheim Investments, Wells Fargo Research. Data as of 7.31.2026. FICO is a data analytics company that provides credit scoring services. WAL = weighted average life. CE = credit enhancements. LTV = loan to value.
Structures and Underwriting Provide Meaningful Investor Protection
Transaction structure is another key strength. Most deals pool 500 to 2,000 mortgage loans in a special purpose vehicle (SPV), issuing multiple tranches with a senior-subordinate structure that distributes payments according to strict priority—providing significant credit protection to senior bondholders.
RMBS securitizations incorporate subordination, performance tests for collateral delinquency rates and losses, and excess interest. These features help insulate senior bondholders from collateral volatility and establish mechanisms for blunting deteriorating loan performance. The post-GFC regulatory regime reinforces loan quality: the ability to repay (ATR) rule requires documented verification of borrower capacity across multiple underwriting factors, and Dodd-Frank’s 5 percent risk retention requirement ensures sponsors retain economic exposure to deal performance.
The Non-Agency Market Has Matured and Diversified
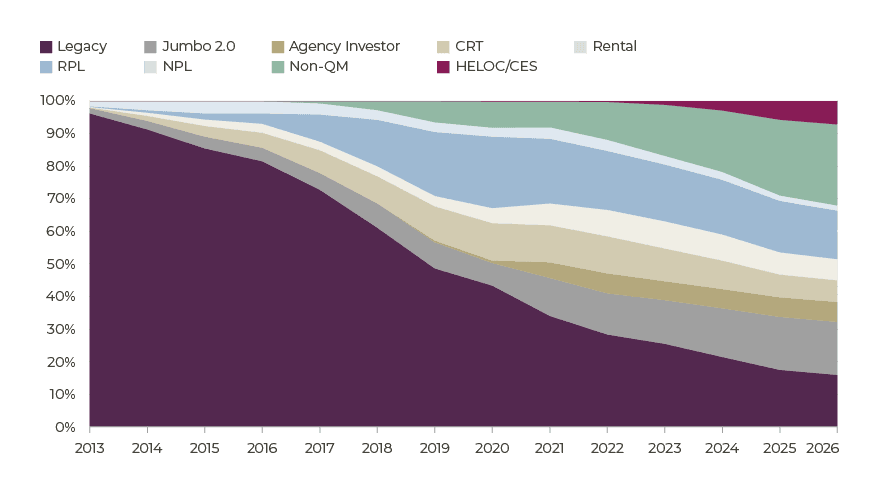
In the years following the GFC, non-Agency RMBS contracted to two narrow poles: legacy distressed and nonperforming loan backed deals traded among opportunistic credit investors, and a thin sliver of ultra-prime jumbo issuance from large banks. As regulatory ambiguity dissipated, the market reconstituted around its core function: serving the substantial population of creditworthy borrowers whose profiles fall outside GSE guidelines.
RMBS Market Has Diversified, Offering Distinct Collateral Types
RMBS Market Outstanding
Source: Guggenheim Investments, J.P. Morgan Research. Data as of 5.31.2026.
The result is a meaningfully broader and more investable market. Today’s non-Agency landscape spans nine distinct collateral types—prime jumbo, agency investor, non-QM, credit risk transfer, reperforming loans (RPL)/non-performing loans (NPL), single family rental, residential transitional loans, home equity lines of credit (HELOC)/closed-end second mortgage (CES), and reverse mortgage—each with differentiated risk-return and prepayment characteristics. Guggenheim has the platform depth and capabilities to invest across these categories, tailoring focus and allocations depending on market conditions and available investment opportunities.
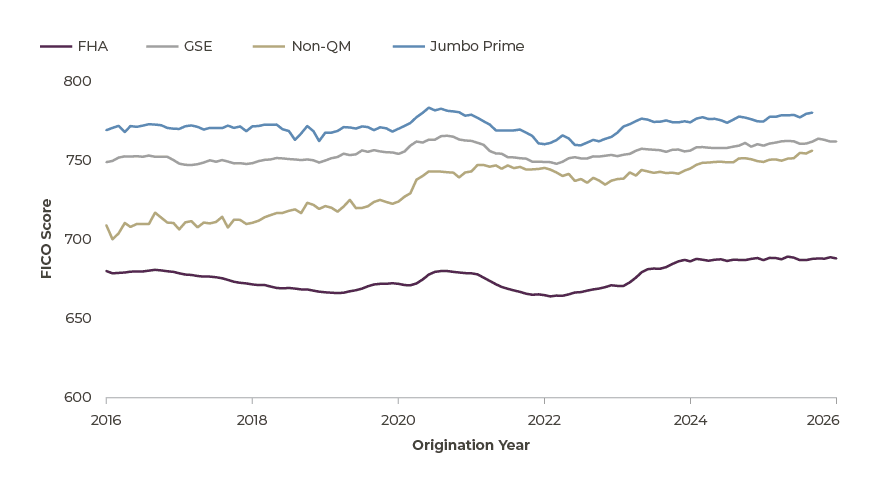
FICO Scores of Non-QM Borrowers are Approaching Those of Prime Conventional Borrowers
Borrower FICO Scores Across Key Sectors
Source: Guggenheim Investments, CoreLogic, Ginnie Mae, Freddie Mac, Nomura Data as of 7.31.2026.
Non-QM RMBS has grown from a niche post-crisis product into a $200 billion market that is expected to see roughly $100 billion of issuance this year— equating to approximately 7 percent of GSE gross issuance. Borrowers are typically higher income, self-employed professionals or investors in non-owner-occupied properties, increasingly carrying FICO scores approaching those of prime conventional loan borrowers. As lender participation has expanded, non-QM loan rates have converged toward conventional mortgage levels, facilitating the sector’s growth without an erosion in credit standards.
Non-QM and Conventional Mortgage Rates Have Converged
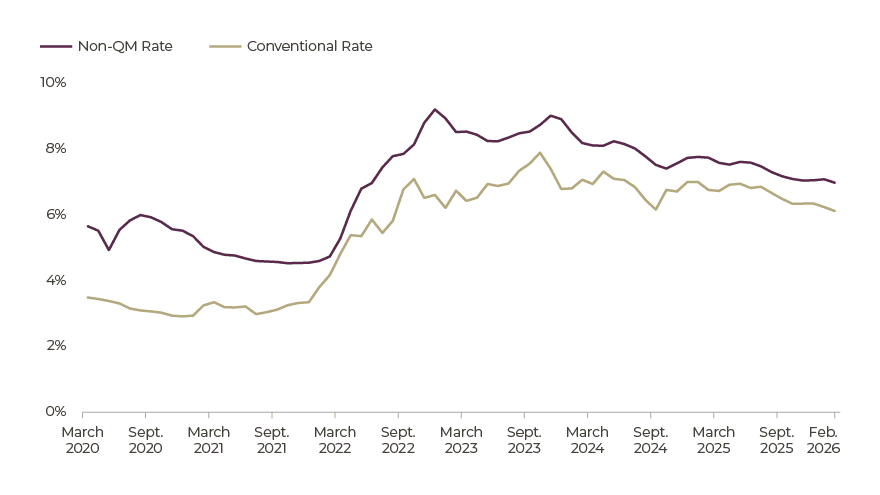
Source: Guggenheim Investments, Bank of America Research, Bloomberg Data as of 2.28.2026.
Growth in non-QM origination is happening across a fragmented originator base with many smaller lenders funding and accumulating loans over short windows before securitizing, creating a supply dynamic of many small deals simultaneously vying for investor focus. The fragmented syndication calendar may limit potential issuance in a scenario where mortgage rates fall, potentially reducing spread widening.
Non-QM loans are definitionally not eligible for GSE programs. Therefore, borrowers generally have fewer options for refinancing when mortgage rates move in their favor. This structural friction should reduce over the long term with greater adoption and the application of technology, but in the shorter term, it translates to lower refinance propensity and lower option cost for bondholders, which we do not believe are efficiently priced by the market today.
Home equity products—including HELOCs and CESs— have emerged as one of the fastest-growing non-Agency subsectors, with roughly $40 billion outstanding and an expected $35 billion in new issuance this year. The investment thesis is straightforward: mortgaged U.S. homeowners hold approximately $17.7 trillion in aggregate equity (peaking in the second quarter of 2024), of which roughly $11 trillion is classified as tappable, making the addressable market for home equity extraction substantial. These loans commonly allow borrowers to access 10–20 percent of their home value without refinancing a low-coupon first mortgage. Equity extraction by low-LTV, low-coupon first-lien borrowers represents the final chapter of quantitative easing era stimulus transmission: embedded home price gains are converted into spendable liquidity without unwinding the favorable high-debt service coverage and low prepayment propensity that underpin the current RMBS market.
Investment Implications
We remain constructive on non-Agency RMBS, which is a core allocation in our investment strategies. The thesis rests on a combination of strong mortgage credit fundamentals, meaningful structural protections, and a relative value proposition that remains compelling even at the tighter end of the historical spread range. When combined with an outlook that continues to call for range bound interest rates, harvesting carry with limited prepayment risk is attractive. The sector currently offers yields in the 5.5 percent range for investment-grade rated tranches and 7–8.5 percent for non-investment grade tranches.
Where We See Opportunity
Investment-grade tranches backed by non-QM and second lien collateral. These offer shorter duration, loss remoteness at current credit enhancement levels, and reduced prepayment sensitivity—particularly where collateral includes investor property loans with prepayment penalties. The favorable optionality profile relative to Agency MBS is a key differentiator: Holders capture attractive spread without bearing the same degree of adverse call risk in a rally.
Select NPL and RPL transactions where elevated credit spreads and material structural incentives for timely redemption of deals (including coupon step-ups and preferential amortization for senior bonds) compensate for the analytical complexity and illiquidity inherent in distressed collateral.
Unrated pass-through structures backed by recently originated
loans, where investors can capture a greater share of the underlying asset economics.
For more risk tolerant strategies, certain subordinate and interest-only tranches offer compelling return potential, though they demand intensive collateral modeling and sensitivity analysis around prepayments and the potential gradual change in the weighted-average coupon of the underlying mortgage pool, known as coupon drift.
Where We Are Cautious
Prime jumbo deals, where high callability from large loan size and an increasingly efficient, technology-enabled mortgage finance ecosystem erode the income advantage in a falling rate environment.
Deeply subordinated tranches where current yields generally do not adequately compensate for the embedded volatility and exposure to idiosyncratic collateral behavior.
Non-Agency RMBS offers a rare combination in today’s fixed-income landscape: attractive current income, structural downside protection via credit enhancement and borrower equity, and a convexity profile less influenced by the adverse call risk that defines the Agency MBS market. In a macroeconomic environment in which geopolitical shocks and rate uncertainty will test portfolio resilience, those characteristics should provide a solid foundation for both income and risk-adjusted returns.
Structured Credit Market Performance
Structured Credit Performance Statistics—Yields, Total Returns, Default Rates and Net Rating Migration
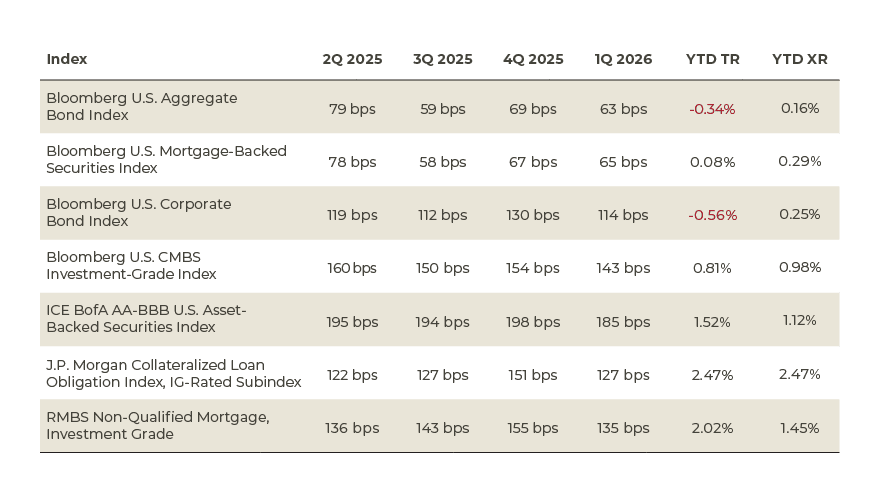
Source: Guggenheim Investments, Bloomberg, J.P. Morgan, Citigroup. Data as of 6.30.2026. YTD TR is year-to date total return. YTD XR is year-to-date excess return. *RMBS spreads are Guggenheim Investments internal values; RMBS returns are from Citigroup.
Structured Credit Issuance by Subsector
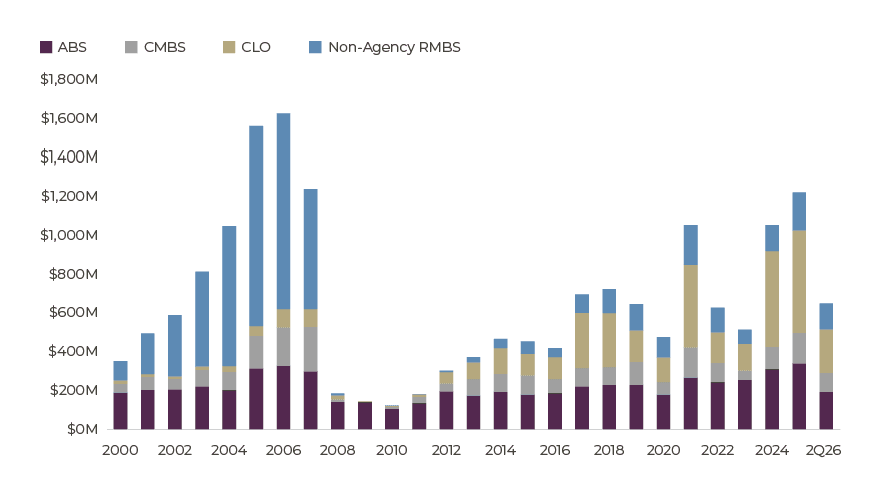
Source: Guggenheim Investments, J.P. Morgan. Data as of 6.30.2026.
Important Notices and Disclosures
Important Notices and Disclosures
The referenced indexes are unmanaged and not available for direct investment. Index performance does not reflect transaction costs, fees or expenses.
The Bloomberg U.S. Aggregate Bond Index is a broad-based flagship benchmark that measures the investment grade, US dollar-denominated, fixed-rate taxable bond market. The index includes Treasurys, government-related and corporate securities, MBS (Agency fixed-rate and hybrid ARM pass-throughs), ABS, and CMBS (Agency and non-Agency).
The Bloomberg U.S. CMBS Investment-Grade Index measures the market of U.S. Agency and U.S. non-Agency conduit and fusion CMBS deals with a minimum current deal size of $300m.
The Bloomberg U.S. Corporate Bond Index measures the investment grade, fixed-rate, taxable corporate bond market. It includes USD denominated securities publicly issued by U.S. and non-U.S. industrial, utility, and financial issuers.
The Bloomberg U.S. Mortgage Backed Securities (MBS) Index tracks fixed-rate agency mortgage backed pass-through securities guaranteed by Ginnie Mae (GNMA), Fannie Mae FNMA), and Freddie Mac (FHLMC).
The ICE BofA U.S. Fixed & Floating Rate Asset Backed Securities Index tracks the performance of USD-denominated investment-grade asset backed securities publicly issued in the US domestic market.
The J.P. Morgan Collateralized Loan Obligation Index is a rules-based observable pricing and total return index for collateralized loan obligation debt for sale in the United States, original rated A, BBB, or BB or equivalent rating.
Carry is the net income earned from holding a bond.
A non-performing loan (NPL) is a loan in default or close to default because the borrower has missed scheduled payments of principal or interest for a prolonged period, typically 90 days or 180 days. A re-performing loan (RPL) is a loan that was late by 90 days or more, but the borrower started making payments again.
Past performance does not guarantee future results.
Investing involves risk, including the possible loss of principal. In general, the value of a fixed-income security falls when interest rates rise and rises when interest rates fall. Longer term bonds are more sensitive to interest rate changes and subject to greater volatility than those with shorter maturities. During periods of declining rates, the interest rates on floating rate securities generally reset downward and their value is unlikely to rise to the same extent as comparable fixed rate securities. High yield and unrated debt securities are at a greater risk of default than investment grade bonds and may be less liquid, which may increase volatility. Investors in asset-backed securities, including mortgage-backed securities and collateralized loan obligations (“CLOs”), generally receive payments that are part interest and part return of principal. These payments may vary based on the rate loans are repaid. Some asset-backed securities may have structures that make their reaction to interest rates and other factors difficult to predict, making their prices volatile and they are subject to liquidity and valuation risk. CLOs bear similar risks to investing in loans directly, such as credit, interest rate, counterparty, prepayment, liquidity, and valuation risks. Loans are often below investment grade, may be unrated, and typically offer a fixed or floating interest rate. Private debt investments are generally considered illiquid and not quoted on any exchange; thus they are difficult to value. The process of valuing investments for which reliable market quotations are not available is based on inherent uncertainties and may not be accurate. Further, the level of discretion used by an investment manager to value private debt securities could lead to conflicts of interest. There is no guarantee that an active manager’s views will produce the desired results or expected returns, which may lead to underperformance. Actively managed investments generally charge higher fees than passive strategies, which could affect performance. In addition, active and frequent trading that can accompany active management, also called “high turnover,” may lead to higher brokerage costs and have a negative impact on performance. Further, active and frequent trading may lead to adverse tax consequences.
This material is distributed or presented for informational or educational purposes only and should not be considered a recommendation of any particular security, strategy or investment product, or as investing advice of any kind. This material is not provided in a fiduciary capacity, may not be relied upon for or in connection with the making of investment decisions, and does not constitute a solicitation of an offer to buy or sell securities. The content contained herein is not intended to be and should not be construed as legal or tax advice and/or a legal opinion. Always consult a financial, tax and/or legal professional regarding your specific situation.
This material contains opinions of the author, but not necessarily those of Guggenheim Partners, LLC or its subsidiaries. The opinions contained herein are subject to change without notice. Forward looking statements, estimates, and certain information contained herein are based upon proprietary and non-proprietary research and other sources. Information contained herein has been obtained from sources believed to be reliable, but are not assured as to accuracy. Past performance is not indicative of future results. There is neither representation nor warranty as to the current accuracy of, nor liability for, decisions based on such information.
NOT FDIC INSURED | NOT BANK GUARANTEED | MAY LOSE VALUE
©2026, Guggenheim Partners, LLC. No part of this article may be reproduced in any form, or referred to in any other publication, without express written permission of Guggenheim Partners, LLC. Guggenheim Funds Distributors, LLC is an affiliate of Guggenheim Partners, LLC. For information, call 800.345.7999 or 800.820.0888.
5836625