/page-types/sector-views/high-yield-and-bank-loan-outlook-august-2025

Evaluating Tariff Impacts on Leveraged Credit Earnings Expectations
Identifying opportunities in higher quality leveraged credit.
High Yield and Bank Loan Outlook
Third Quarter 2025
Leveraged credit continues to offer compelling opportunities, but emerging challenges make active management, rigorous credit selection, and a focus on higher quality issuers critical to capture high all-in yields while potentially safeguarding against downside risk.
With the second half of 2025 underway, the U.S. leveraged credit market appears priced to perfection, even as policy and economic uncertainty persist. While valuations reflect still-solid fundamentals and benign defaults, the main forces pushing spreads tighter have been persistent demand for yield and limited net supply.
Moderating economic growth, fluid trade policy, and high tariffs are introducing pressures across sectors. Although credit fundamentals remain generally healthy, downward revisions to earnings expectations signal emerging challenges. To date, these pressures have been more visible in forecasts and ratings migration than in actual financial results, but this could change in coming quarters.
Report Highlights:
- Despite recent progress on trade negotiations, tariffs and related uncertainty continue to pressure the U.S. economic outlook, widening the range of potential outcomes for credit.
- Substantial downside risk remains should trade negotiations disappoint or if a deeper shock becomes evident when the full impact of tariffs materializes.
- The leveraged credit market delivered positive returns, supported by strong demand and limited supply, despite moderating growth and sector-specific pressures.
- Spreads for the strongest credits remain near historical tights, while spreads for weaker credits are wider, reflecting investor caution amid softening earnings expectations and tariff-related cost pressures.
- We currently favor high yield corporates with stronger credit profiles and less exposure to tariff impacts and we are maintaining cash to capitalize on relative value opportunities as spreads evolve.
Macroeconomic Outlook
The U.S. Economy Is Cooling, and Downside Risks Remain Elevated
Macroeconomic data continue to reveal a gradually cooling U.S. economy. Although swings in net exports and inventories from tariff frontrunning have been clouding the data, private final demand has trended lower over the first half of the year as consumers and businesses grapple with policy uncertainty.
Despite recent progress in trade negotiations, the average U.S. tariff rate remains elevated at 18 percent—the highest level since the 1930s—and could rise further. While downside economic risks have shrunk as the tariff rollout has been more gradual than the Liberation Day shock, historically high tariffs will still exert pressure on input costs and corporate margins in coming months, with potential knock-on effects for both real consumer incomes and business investment.
The July Consumer Price Index (CPI) report indicates that inflation remains somewhat elevated (the gain in core CPI was the highest since January), but price increases driven by tariff pass-through have been slower to materialize than many feared. Reading tariff impacts is likely to be choppy over the next few reports, as the report suggests businesses are absorbing some of the cost at this stage, but it is not clear they will bear the cost indefinitely. Price hikes on affected products could unfold gradually over time, but given recent consumption patterns we expect that it would pressure consumer spending. Our baseline outlook anticipates core Personal Consumption Expenditures (PCE) inflation rising above 3 percent in 2025, but negative demand impacts from higher prices should help inflation moderate toward the Fed’s 2 percent target in 2026.
Businesses also remain cautious. Small business optimism has improved from April lows, but overall sentiment is subdued, and capital expenditure plans remain restrained. Many firms appear to be in a holding pattern, awaiting greater clarity on tariff policy before committing to new projects. Tariff collections in June reached about 1 percent of gross domestic product (GDP), raising the risk that higher costs will either compress margins or be passed on to consumers, potentially deepening the pullback in spending.
Despite these challenges, we expect a continued moderation in growth rather than a more pronounced downturn. Corporate profits remain healthy, which should help cushion some of the impact of tariff costs. Consumer sentiment has revived from April lows and financial conditions have become more supportive, helped by strong equity markets and a weakening dollar. Markets have become more inured to tariff developments, with subdued volatility, a return of credit spreads to historical lows, and stable corporate earnings growth.
We expect two rate cuts by the Federal Reserve (Fed) in 2025 and additional cuts in 2026, bringing the policy rate to 3–3.25 percent by year-end 2026. As growth slows, the labor market should soften further in coming months, encouraging the Fed to ease policy, provided tariff-driven price increases remain contained to goods and inflation expectations are stable. However, we continue to see risks tilted toward more rate cuts if labor market conditions materially worsen amid pervasive economic uncertainty.
Leveraged Credit Review
Demand Outpaces Supply as Risk Appetite Recovers
Credit markets continue to be shaped by attractive yields (7 percent in high yield bonds and 8 percent in loans1 and a very favorable technical environment, which are driving risk premiums tighter. Spreads have returned to near historical tights, with high yield bond credit spreads at 284 basis points, placing them in the 2nd percentile of levels over the past 20 years. Loan discount margins are at their tightest levels since 2022 and rank in the 24th percentile over the last two decades, with higher quality spreads even tighter relative to history (BBs at the 12th percentile and Bs at the 14th percentile). These valuations indicate that investor demand remains strong.
Spreads Retrace Nearly All the Tariff-Related Weakness
Spreads and Discount Margins as Percentiles since 2001
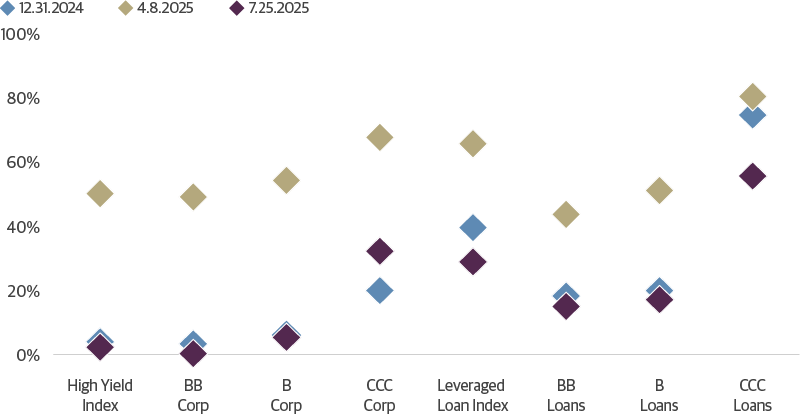
Source: Guggenheim Investments, Bloomberg. Data as of 7.25.2025.
Increased clarity on trade policies is fueling market optimism. The April 8 pause on reciprocal tariffs marked a turning point, followed by a series of constructive developments, including a truce with China, and deals with the U.K., Japan and EU.
While credit demand has recovered, net new supply remains limited. Most bond and loan issuance has been focused on refinancing or repricing. In the high yield corporate bond market, new issuance has been largely matched by the market’s coupon reinvestments and net positive fund flows since May. In the loan market, fund flows have been weak, with year-to-date outflows of more than $3 billion. But net loan supply is constrained by heavy repricing and refinancing volume, while collateralized loan obligation (CLO) formation has been strong. These imbalances push participants into the secondary market, supporting prices.
Amid ongoing policy uncertainty and slower growth, we do not see a near-term catalyst for a material shift in these dynamics. Borrowers remain focused on addressing upcoming maturities and pursuing opportunistic repricing, rather than raising new capital. Meaningful additional issuance in the high yield bond and syndicated loan markets appears unlikely with borrowing costs still elevated and private credit capturing a larger share of new issuance.
Healthy Fundamentals, but Softening Expectations
Fundamentals in the bank loan and high yield bond sectors remain broadly healthy. In both sectors, leverage is only modestly above the average of the last decade. Median interest coverage ratios are close to their decade averages—4x for bank loans (vs. 4.1x) and 4.3x for high yield bonds (vs. 4.2x). It is important to note, however, that the bond market is primarily composed of BB-rated issuers, while the loan market has a greater concentration of B-rated issuers. Publicly reported metrics tend to overstate the share of higher quality (BB) issuers in the loan market, suggesting that actual leverage may be understated. Even so, our assessment is that, for the public market, credit fundamentals remain close to recent historical averages.
Interest Coverage Is Healthy for Higher Quality Leveraged Credit
Median LTM EBITDA Interest Coverage
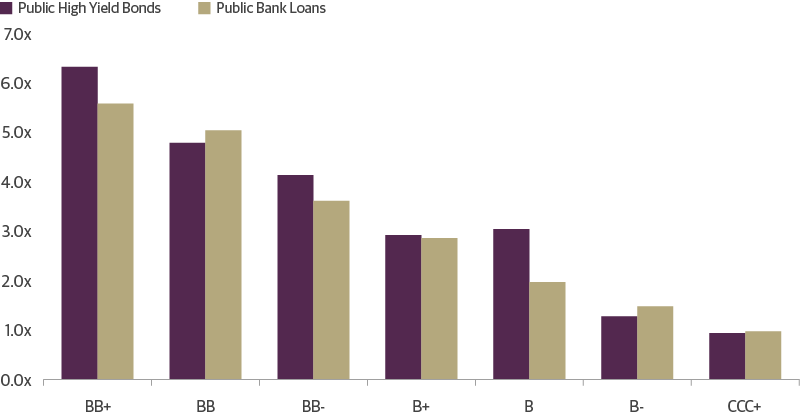
Source: Guggenheim Investments, S&P Capital IQ, Bloomberg. Data as of 3.31.2025.
However, analyst forecasts for growth in leveraged credit earnings before interest, tax, depreciation and amortization (EBITDA) have been revised down by 7 percent since the start of the year, reflecting a mix of persistent headwinds and the added impact of tariffs. At the beginning of 2025, consensus expectations called for 19 percent EBITDA growth in leveraged credit this year compared to 2024; this has now been reduced to 12 percent. According to BofA Research and Pitchbook LCD, EBITDA growth in both the bank loan and high yield bond sectors was just 2 percent in the first quarter of 2025, following a modest 3 percent increase for the full year in 2024. Therefore, current forecasts still look optimistic.
Analysts Remain Optimistic About Earnings Growth in Leveraged Credit
Leveraged Credit EBITDA Growth, Actual and 2025 Expected
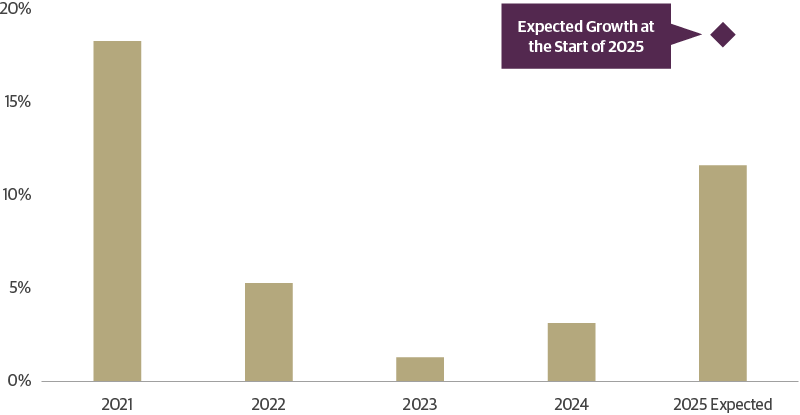
Source: Guggenheim Investments, Bloomberg, S&P CapIQ. Data as of 8.8.2025. Based on a universe of publicly available information for U.S. high yield corporate bond and institutional leveraged loan issuers.
Although downward estimate revisions are common—EBITDA expectations fell 4 percent from January through July in 2024—this year’s cuts have been noticeably sharper in consumer cyclical and technology sectors, where EBITDA forecasts have each dropped by approximately 10 percentage points. In some areas of consumer-related sectors, like food and beverage, weakness in demand has persisted since inflation bifurcated the consumer sector by pressuring lower-income household budgets.
Leveraged Credit 2025 Earnings Expectations Have Weakened
Cumulative Change in 2025 FY EBITDA Since Dec. 31
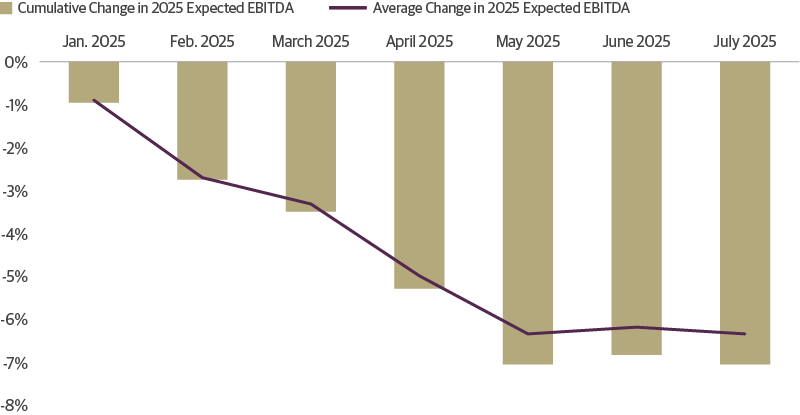
Source: Guggenheim Investments, Bloomberg, S&P Capital IQ. Data as of 7.28.2025.
Several issuers in the technology sector have reported ongoing end-market softness, driven by delayed enterprise technology spending and weaker industrial investment. This contrasts with the record profits often in the headlines from large-cap tech firms benefiting from strong demand in artificial intelligence and cloud infrastructure. In the high yield universe, semiconductor companies—more heavily exposed to automotive, industrial, and consumer electronics markets—have faced weakness exacerbated by higher interest rates and delayed discretionary spending. Additionally, soft electric vehicle sales have disrupted product launches and pressured earnings across the supply chain.
Most Sectors Have Seen 2025 Earnings Expectations Decline Since Dec. 31
Change in Cumulative Expected 2025 EBITDA
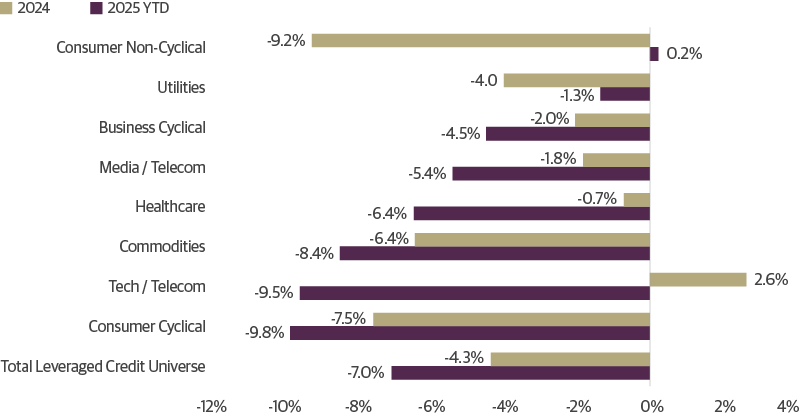
Source: Guggenheim Investments, Bloomberg, S&P Capital IQ. Data as of 7.28.2025.
Tariff policy has intensified challenges in both loan and bond sectors. For many issuers, tariffs have raised input costs, renewing focus on margin resilience and management’s ability to protect profitability. Companies must decide whether to absorb these costs, cut expenses elsewhere, or pass them through to consumers. The ability to pass on higher costs, however, is limited by demand elasticity and competitive dynamics, as excessive price increases risk eroding consumer demand and market share—especially in sectors already under pressure from increasingly selective consumers.
With growth slowing, tariffs re-emerging, and cost pressures building, we are keeping close watch to avoid unexpected negative ratings migration in portfolios. Early signs are evident: In the second quarter of 2025, S&P Global Ratings downgraded 32 high yield issuers and upgraded just 12—the highest quarterly number of issuer downgrades since the second quarter of 2023, and a meaningful increase from 17 downgrades in the first quarter.
Issuer Credit Rating Downgrades Accelerated in Q2 2025
Spec-Grade Issuer Upgrades vs Downgrades by S&P Global Ratings
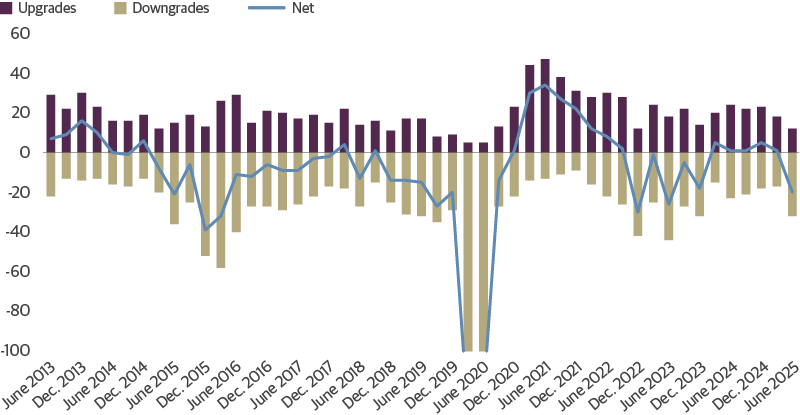
Source: Guggenheim Investments, S&P Creditpro. Data as of 6.30.2025.
Investment Implications
As of June, high yield bond defaults stand at just 1.1 percent par-weighted and 2.6 percent issuer-weighted, well below their 20-year average of closer to 3.5 percent. In the loan market, default rates are somewhat higher—2.8 percent on a par-weighted basis and 3.3 percent on an issuer-weighted basis—reflecting the sector’s concentration in lower-rated credits and its higher sensitivity to interest rates.
Tight spreads suggest the market is priced for positive economic outcomes. Assuming recovery rates of 40 percent for bonds and 50 percent for loans (based on last 12-month trends), and incorporating reasonable assumptions for liquidity risk premiums, we estimate that current spreads imply default rates of 3–4 percent for loans and 1–2 percent for bonds over the next 12 months. These levels are broadly in line with recent default rates but offer limited cushion against negative surprises.
High yield bond spreads are tighter relative to their history than loans, reflecting the sector’s improved credit profile and resilience after widespread 2021 refinancing at historically low coupons. This has supported low defaults through the challenging macro environment of the past few years. Looking ahead, rising average coupons—now at 6.6 percent, up from 5.7 percent in 2022—could challenge the market’s fundamental resilience. At the same time, these higher coupons generate increased cash flows that need to be reinvested, which may provide technical support and keep spreads tight. Investors will need to watch this tension between weakening fundamentals and supportive technicals as it unfolds.
High Yield Issuers Are Gradually Absorbing Higher Rates
Distribution of Coupon Rates in the HY Index, By Debt Par Value
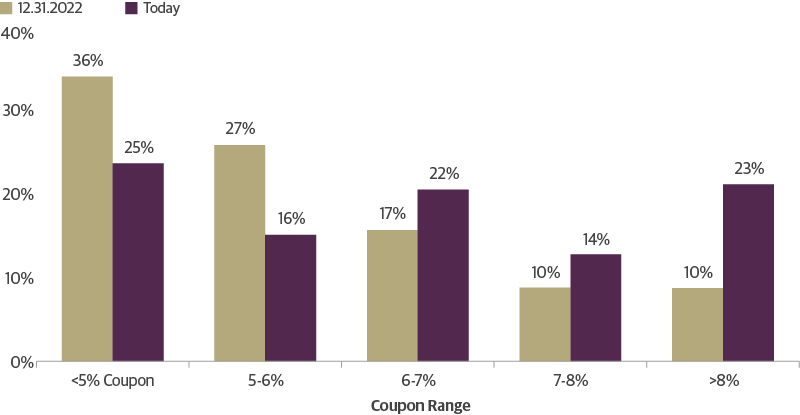
Source: Guggenheim Investments, Bloomberg, ICE Index Services. Data as of 7.24.2025.
In the loan market, Fed easing could provide some relief, but pressure is shifting to cash flow and profitability as the economy slows. We expect loan defaults to remain above average and driven by liability management exercises as sponsors and lenders engage in aggressive tactics to prioritize their claims in this environment. But EBITDA expectations for issuers in both sectors are falling as investors expect rising costs and shrinking consumer demand, particularly in the consumer cyclicals, technology, and commodity sectors.
Both Bond and Loan Issuers See Expectations Weaken
Decline in 2025 EBITDA by Issuer Type
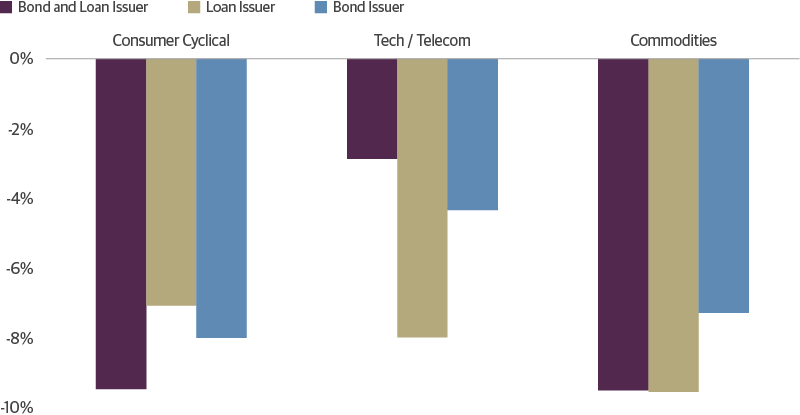
Source: Guggenheim Investments, Bloomberg, S&P Capital IQ. Data as of 7.28.2025.
All-in compensation for both asset classes remains appealing, in our view, but given the uncertain macro backdrop and our position in the credit cycle, risk premiums across both sectors appear compressed. This is particularly concerning in the loan market, where spreads are approaching historical tights, even as the proportion of B3/B- rated assets rises and recovery rates decline—factors that we believe should warrant higher risk premiums. This context heightens the importance of avoiding mistakes, making rigorous credit selection more critical to capture on attractive yields while limiting downside risk.
In our view, the most compelling opportunities lie in higher quality leveraged credit, identified through deep issuer analysis. Sectors with resilience to macro challenges—such as financial services within the broader services sector—stand out, as do select areas of technology that are less exposed to weak end-market demand. Ultimately, a disciplined focused on the stability and resilience of the underlying cash flows is essential to ensure issuers can pay back interest and principal.
Leveraged Credit Scorecard
As of 6.30.2025
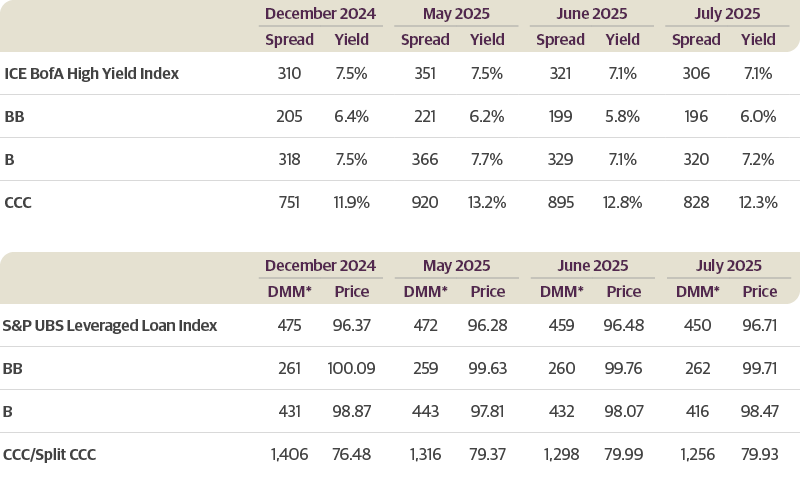
Source: ICE BofA, S&P UBS. *Discount Margin to Maturity assumes three-year average life. Past performance does not guarantee future results.
ICE BofA High Yield Index Returns
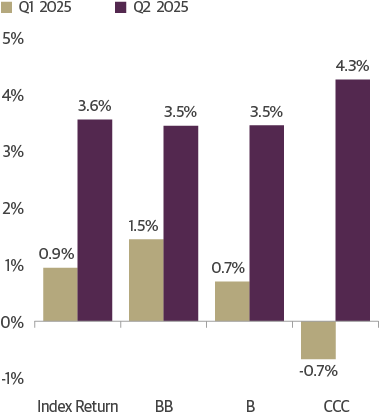
Source: ICE BofA. Data as of 6.30.2025. Past performance does not guarantee future results
S&P UBS Leveraged Loan Index Returns
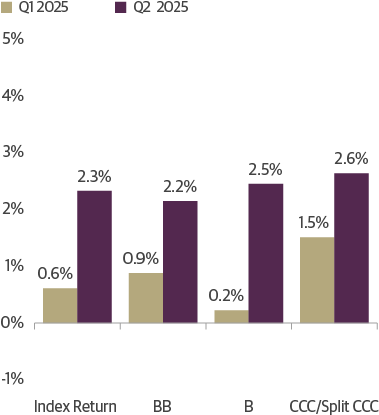
Source: S&P UBS. Data as of 6.30.2025. Past performance does not guarantee future results.
Important Notices and Disclosures
INDEX AND OTHER DEFINITIONS
The referenced indices are unmanaged and not available for direct investment. Index performance does not reflect transaction costs, fees or expenses.
The S&P UBS Leveraged Loan Index is designed to mirror the investable universe of the USD-denominated leveraged loan market. It consists of issues rated “5B” or lower, meaning that the highest rated issues included in this index are Moody’s/S&P ratings of Baa1/BB+ or Ba1/ BBB+. All loans are funded term loans with a tenor of at least one year and are made by issuers domiciled in developed countries.
The ICE BofA U.S. High Yield Index tracks the performance of US dollar denominated below investment grade corporate debt publicly issued in the US domestic market. Qualifying securities must have a below investment grade rating (based on an average of Moody’s, S&P and Fitch), at least 18 months to final maturity at the time of issuance, at least one year remaining term to final maturity as of the rebalancing date, a fixed coupon schedule and a minimum amount outstanding of $250 million. In addition, qualifying securities must have risk exposure to countries that are members of the FX-G10, Western Europe or territories of the US and Western Europe. The FX-G10 includes all Euro members, the U.S., Japan, the UK, Canada, Australia, New Zealand, Switzerland, Norway and Sweden.
A basis point (bps) is a unit of measure used to describe the percentage change in the value or rate of an instrument. One basis point is equivalent to 0.01 percent.
AAA is the highest possible rating for a bond. Bonds rated BBB or higher are considered investment grade. BB, B, and CCC-rated bonds are considered below investment grade and carry a higher risk of default, but offer higher return potential. A split bond rating occurs when rating agencies differ in their assessment of a bond.
The three-year discount margin to maturity (DMM), also referred to as discount margin, is the yield-to-refunding of a loan facility less the current three-month Libor rate, assuming a three year average life for the loan.
The interest coverage ratio is a debt and profitability ratio used to determine how easily a company can pay interest on its outstanding debt.
The leverage ratio is a metric that expresses how much of a company’s operations or assets are financed with borrowed money.
Spread is the difference in yield to a Treasury bond of comparable maturity.
Dry powder refers to highly liquid assets, such as cash or money market instruments, that can be invested when more attractive investment opportunities arise.
1 Source: ICE BofA High Yield Index, S&P UBS Leveraged Loan Index
Investing involves risk, including the possible loss of principal. In general, the value of a fixed-income security falls when interest rates rise and rises when interest rates fall. Longer term bonds are more sensitive to interest rate changes and subject to greater volatility than those with shorter maturities. During periods of declining rates, the interest rates on floating rate securities generally reset downward and their value is unlikely to rise to the same extent as comparable fixed rate securities. High yield and unrated debt securities are at a greater risk of default than investment grade bonds and may be less liquid, which may increase volatility. Investors in asset-backed securities, including mortgage-backed securities and collateralized loan obligations (“CLOs”), generally receive payments that are part interest and part return of principal. These payments may vary based on the rate loans are repaid. Some asset-backed securities may have structures that make their reaction to interest rates and other factors difficult to predict, making their prices volatile and they are subject to liquidity and valuation risk. CLOs bear similar risks to investing in loans directly, such as credit, interest rate, counterparty, prepayment, liquidity, and valuation risks. Loans are often below investment grade, may be unrated, and typically offer a fixed or floating interest rate.
This article is distributed for informational or educational purposes only and should not be considered a recommendation of any particular security, strategy or investment product, or as investing advice of any kind. This article is not provided in a fiduciary capacity, may not be relied upon for or in connection with the making of investment decisions, and does not constitute a solicitation of an offer to buy or sell securities. The content contained herein is not intended to be and should not be construed as legal or tax advice and/or a legal opinion. Always consult a financial, tax and/or legal professional regarding your specific situation.
This article contains opinions of the author but not necessarily those of Guggenheim Partners or its subsidiaries. The author’s opinions are subject to change without notice. Forward-looking statements, estimates, and certain information contained herein are based upon proprietary and non-proprietary research and other sources. Information contained herein has been obtained from sources believed to be reliable, but are not assured as to accuracy. No part of this article may be reproduced in any form, or referred to in any other publication, without express written permission of Guggenheim Partners, LLC. Past performance is not indicative of future results. There is neither representation nor warranty as to the current accuracy of, nor liability for, decisions based on such information.
©2025, Guggenheim Partners, LLC. No part of this article may be reproduced in any form, or referred to in any other publication, without express written permission of Guggenheim Partners, LLC. Guggenheim Funds Distributors, LLC is an affiliate of Guggenheim Partners, LLC. For information, call 800.345.7999 or 800.820.0888.
Member FINRA/SIPC GPIM 65884
Tune in to Macro Markets to hear the top minds of Guggenheim Investments offer timely analysis on financial market trends. Guests include portfolio managers, fixed income sector heads, members of the Macroeconomic and Investment Research Group, and more.
Guggenheim Investments represents the investment management businesses of Guggenheim Partners, LLC ("Guggenheim"). Guggenheim Funds Distributors, LLC is an affiliate of Guggenheim.
Read a prospectus and summary prospectus (if available) carefully before investing. It contains the investment objective, risks charges, expenses and the other information, which should be considered carefully before investing. To obtain a prospectus and summary prospectus (if available) click here or call 800.820.0888.
Investing involves risk, including the possible loss of principal.
Guggenheim Investments represents the following affiliated investment management businesses of Guggenheim Partners, LLC: Guggenheim Partners Investment Management, LLC, Security Investors, LLC, Guggenheim Funds Distributors, LLC, Guggenheim Funds Investment Advisors, LLC, Guggenheim Corporate Funding, LLC, Guggenheim Wealth Solutions, LLC, Guggenheim Private Investments, LLC, Guggenheim Investments Loan Advisors, LLC, Guggenheim Partners Europe Limited, Guggenheim Partners Japan Limited, and GS GAMMA Advisors, LLC.
This is not an offer to sell nor a solicitation of an offer to buy the securities herein. GCIF 2019 and GCIF 2016 T are closed for new investments.
©
Guggenheim Investments. All rights reserved.
Research our firm with FINRA Broker Check.
Not FDIC Insured • No Bank Guarantee • May Lose Value
This website is directed to and intended for use by citizens or residents of the United States of America only. The material provided on this website is not intended as a recommendation or as investment advice of any kind, including in connection with rollovers, transfers, and distributions. Such material is not provided in a fiduciary capacity, may not be relied upon for or in connection with the making of investment decisions, and does not constitute a solicitation of an offer to buy or sell securities. All content has been provided for informational or educational purposes only and is not intended to be and should not be construed as legal or tax advice and/or a legal opinion. Always consult a financial, tax and/or legal professional regarding your specific situation. Investing involves risk, including the possible loss of principal.
By choosing an option below, the next time you return to the site, your home page will automatically
be set to this site. You can change your preference at any time.
We have saved your site preference as
Institutional Investors. To change this, update your
preferences.
United States Important Legal Information
By confirming below that you are an Institutional Investor, you will gain access to information on this website (the “Website”) that is intended exclusively for Institutional Investors and, as such, the information should not be relied upon by individual investors. This Website and any product, content, information, tools or services provided or available through the Website (collectively, the “Services”) are provided to Institutional Investors for informational purposes only and do not constitute a recommendation to buy or sell any security or fund interest. Nothing on the Website shall be considered a solicitation for the offering of any investment product or service to any person in any jurisdiction where such solicitation or offering may not lawfully be made. By accessing this Website, you expressly acknowledge and agree that the Website and the Services provided on or through the Website are provided on an as is/as available basis, and except as partnered by law, neither Guggenheim Investments and it parents, subsidiaries and affiliates nor any third party has any responsibility to maintain the website or the Services offered on or through the Website or to supply corrections or updates for the same. You understand that the information provided on this Website is not intended to provide, and should not be relied upon for, tax, legal, accounting or investment advice. You also agree that the terms provided herein with respect to the access and use of the Website are supplemental to and shall not void or modify the Terms of Use in effect for the Website. The information on this Website is solely intended for use by Institutional Investors as defined below: banks, savings and loan associations, insurance companies, and registered investment companies; registered investment advisers; individual investors and other entities with total assets of at least $50 million; governmental entities; employee benefit (retirement) plans, or multiple employee benefit plans offered to employees of the same employer, that in the aggregate have at least 100 participants, but does not include any participant of such plans; member firms or registered person of such a member; or person(s) acting solely on behalf of any such Institutional Investor.
By clicking the "I confirm" information link the user agrees that: “I have read the terms detailed and confirm that I am an Institutional Investor and that I wish to proceed.”