/perspectives/sector-views/high-yield-and-bank-loan-outlook-may-2025

Credit Crossroads: Finding Value in an Era of Uncertainty
Relative value opportunities in volatile spread environment.
High Yield and Bank Loan Outlook
Second Quarter 2025
In recent months, tariffs, and trade policy uncertainty have heightened growth risks and created a more nuanced outlook for credit. Trade tensions have moderated since the April 2 “Liberation Day” announcements and improved sentiment about trade de-escalation has led spreads to tighten materially from their peaks.
Still, the effective tariff rate remains over 10 percentage points higher than the start of the year, which will slow growth and impact some credits. Dispersion across credit has increased notably as investors isolated the likely impact of tariffs across issuers and industries. In this environment, we are prioritizing quality and using the rally to cull vulnerable credits. We currently favor high yield corporates with stronger credit profiles and less exposure to tariff impacts, while maintaining cash to capitalize on relative value opportunities as spreads evolve.
Report Highlights:
- Leveraged credit has performed well this year to date but we are cautious moving forward. Despite recent progress on trade negotiations, tariffs and related uncertainty have weakened the U.S. economic outlook, widening the range of potential outcomes for credit.
- Spreads retraced quickly and, for the strongest credits, are now tighter than at the start of the year. Nonetheless, spreads remain wider year-to-date for the weakest credits in tariff-exposed industries.
- We favor high yield bonds over loans, given their stronger credit profile and greater transparency.
Macroeconomic Outlook
Growth Outlook Dims Amid Rising Uncertainty
After beginning 2025 with solid momentum, the U.S. economic outlook dimmed. The Trump administration’s April 2 Liberation Day tariffs exceeded all estimates, tightening financial conditions and worsening growth prospects. As policy uncertainty soared, sentiment among households and businesses sank, with surveys indicating expectations for both rising prices and unemployment.
A 90-day pause on reciprocal tariffs and framework agreements with China and the U.K. have demonstrated a desire by the administration to de-escalate. The temporary reversal of elevated tariffs on Chinese goods mitigated the risk of an abrupt decoupling and reduced recession risk. Still, we forecast slow growth ahead, as the effective tariff rate on U.S. imports remains around 13 percent. Tariffs will weigh on lower income consumers as higher prices on essentials crowd out discretionary spending. Business investment and hiring is also likely to slow as companies grapple with volatile trade policy, higher input costs, and disrupted supply chains.
Markets have experienced extraordinary swings in response to evolving policy. The S&P 500 was down 15 percent year to date at its lowest point but recovered the loss as optimism about trade deals took hold. Implied and realized volatility spiked sharply around April 2 tariff announcements and remains sensitive to daily policy developments. We believe downside risk remains if trade negotiations disappoint, or if a deeper shock becomes evident when the impact of tariff hikes and uncertainty materializes.
Leveraged Credit Delivered Positive Returns Despite Spread Volatility
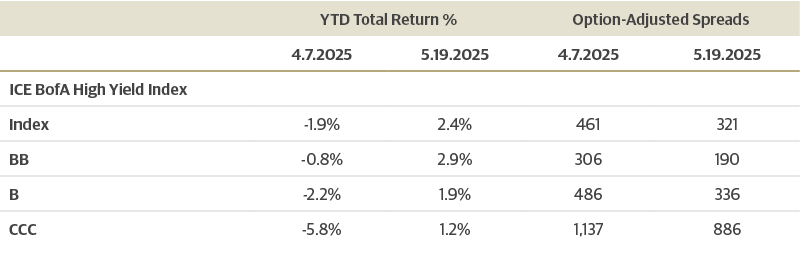
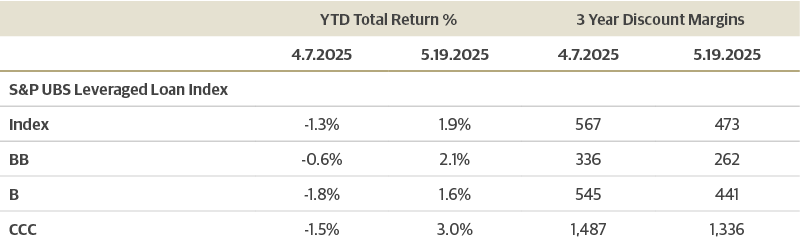
Even in an environment of historically high volatility, leveraged credit generated overall positive returns. The ICE BofA High Yield Index spread spiked to 461 basis points before falling back to 315 basis points by May 12, immediately following the preliminary U.S.-China trade agreement. Leveraged loan three-year discount margins widened to 567 basis points before retracing to 479.
As of May 19, high yield corporate bonds returned 2.4 percent year to date, but performance has been bifurcated: Higher quality issues performed well, with BB- and B-rated bonds returning 2.9 percent and 1.9 percent, respectively, while CCC-rated bonds rose just 1.2 percent. Loans also posted positive returns, but they underperformed fixed-rate corporates. The S&P UBS Leveraged Loan Index returned 1.9 percent overall, with BB-, B-, and CCC-rated loans returning 2.1 percent, 1.6 percent, and 3.0 percent, respectively.
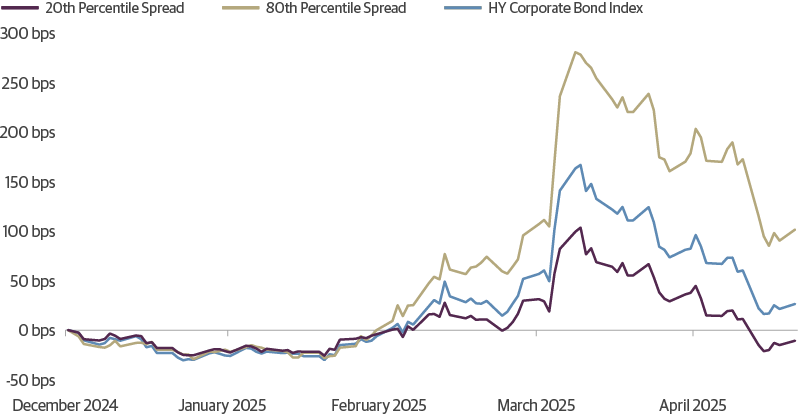
Spreads Have Spiked and Partially Retraced on Tariff News
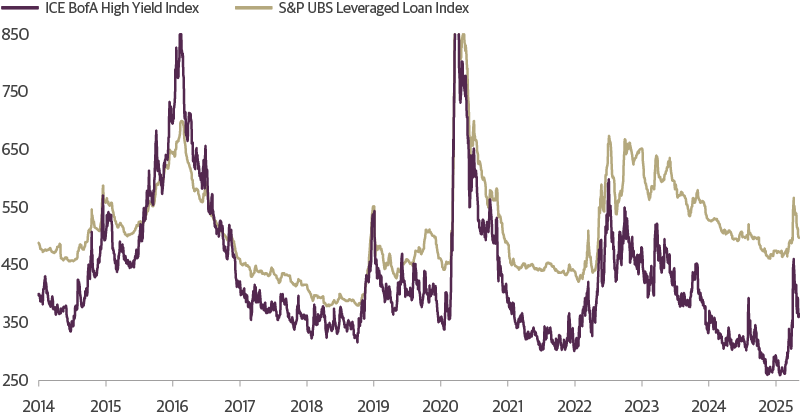
Source: Guggenheim Investments, Bloomberg, S&P UBS, ICE Index Services. Data as of 5.9.2025. Chart truncated for visual purposes.
Sharp Deterioration in Credit Performance on Tariff Announcements Retraced on Trade Deal Optimism
Cumulative YTD Returns
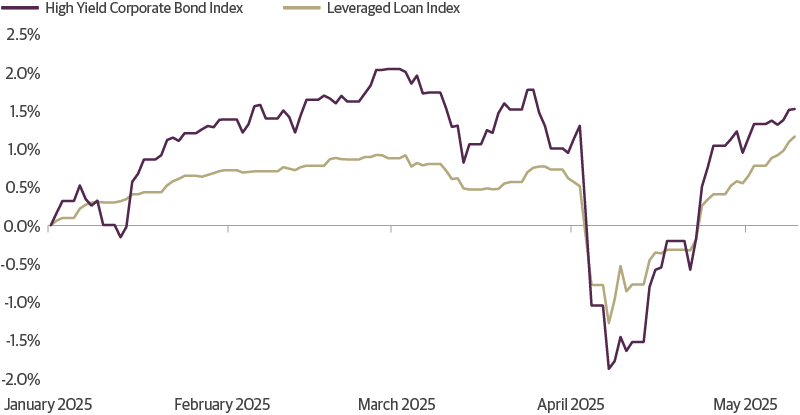
Source: Guggenheim Investments, Bloomberg, ICE Index Services, S&P UBS. Data as of 5.9.2025. Based on the ICE BofA High Yield Index and the S&P UBS Leveraged Loan Index.
Despite large flows in early April—leveraged credit mutual funds and ETFs experienced heavy outflows totaling $16.5 billion in the first two weeks—credit markets continued to function in an orderly fashion. The Bank of America Merrill Lynch Global Fund Manager Survey found that mutual fund managers had boosted liquidity in March in anticipation of potential tariff-related volatility, which provided a buffer against concentrated redemptions and reduced the risk of forced asset sales.
Spreads Retraced, But Remain Wider YTD for the Weakest Credits
Cumulative YTD Change in HY Index Spreads
Source: Guggenheim Investments, Bloomberg. Data as of 5.19.2025.
While improved risk sentiment narrowed spreads, dispersion remains elevated, suggesting markets have priced tariff risk selectively. To gauge where markets are pricing in the weakest and strongest credits relative to the start of the year, we measured the 80th percentile and 20th percentile spread levels in the high yield index on a daily basis. For example, with the high yield index trading closer to 280 basis points at the start of the year, the weakest credits, based on the 80th percentile spread, were trading at 360 basis points or wider, while the strongest credits, based on the 20th percentile spread, were trading at just 156 basis points or tighter. This put the inner range at just 204 basis points. Both strong and weak credits saw spreads widen between March and April as general risk premia increased due to rising growth concerns. But as of May 19, the strongest credits have fully reversed the weakness and are now trading 11 basis points tighter than at the start of the year. The weakest credits are trading 102 basis points wider than where they began the year, pushing the range between the 20th and 80th percentile to 317 basis points. Therefore, markets still require some additional risk premium for vulnerable credits, reflecting a more discerning market.
Discount Margins on the Weakest Loans Remain Wide
Cumulative YTD Change in 3Y Discount Margins
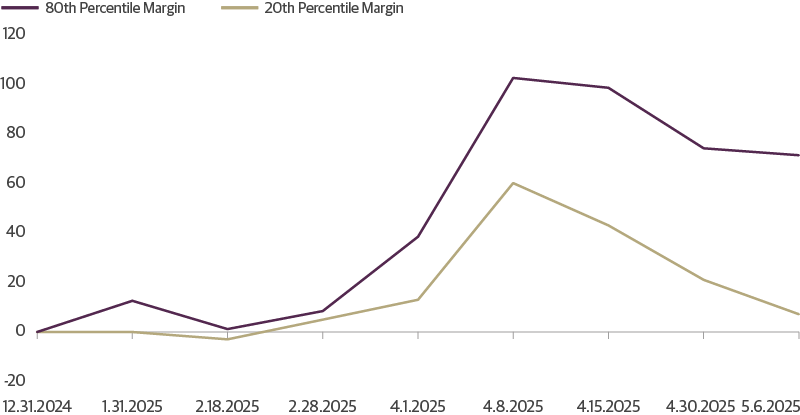
Source: Guggenheim Investments, S&P UBS. Data as of 5.6.2025.
Policy Volatility Creates Opportunity for Managers with Credit Expertise
While progress on trade negotiations has lowered the probability of deeper economic downside risks, we think agreements will ultimately still result in higher effective tariff rates than where we started the year. Furthermore, key negotiations remain outstanding, including with Canada and Mexico where 25 percent tariffs on non-USMCA compliant imports remain in place. We therefore remain cautious in industries with exposures to potential tariffs and trade negotiations.
Products and industries that remain vulnerable to tariff developments include but are not limited to toy manufacturers and retailers, household appliances and durable goods, medical equipment, consumer electronics like cell phones and cameras, clothing, and packaged goods which rely on imported raw materials and packaging components but may also have cross-border supply chains. Energy remains vulnerable to U.S.-Canada trade developments given the deeply integrated bilateral energy trade, with Canada being a crude supplier to the U.S., while the U.S. exports refined products and natural gas back to Canada. Transportation could see further impacts if trade slows, or manufacturing costs rise. Finally, from a trade and general policy perspective, healthcare bears watching due to sectoral tariffs as well as increased pricing focus from the administration’s recent executive order seeking to lower drug costs. Generally speaking, vulnerable sectors span industries related to both goods and services including retail, manufacturing, and commodities. Understanding the individual credit well is the only way to navigate this environment.
We saw the impact of these exposures on year-to-date performance. In the high yield sector, the energy, transportation, and retail industries lagged with returns of -0.1, 0.05, and 0.8 percent through May 19, respectively, after recovering from losses. Particularly hard hit were lower rated CCC-rated bonds, with energy and transportation returning negative 8 percent and negative 11 percent respectively. In the loan market, chemicals posted a loss of 0.4 percent while consumer durables, food/drug and housing significant lagged the index with returns of less than 50 basis points.
Conversely, industries perceived as more resilient—either due to less impact from trade or defensive characteristics—outperformed. High yield telecom, healthcare, and real estate returned 4.3, 4.0, and 3.9 percent through May 19. Within the loan sector, media/telecom and technology gained 3.4 and 2.4 percent respectively. Generally speaking, areas that may be less directly impacted by tariffs include media/communications and financial subsectors such as REITs and banks, but they would be impacted if tariff policy volatility triggers growth concerns again.
With the market now pricing in more narrow impacts and fewer growth-related spillovers, we can see how differentiated spread performance has been even within sectors that are considered more vulnerable to tariffs. For example, in tariff-exposed sectors such as consumer discretionary, materials, and energy, the spreads on the strongest credits are now tighter than where they started the year, while the weakest credits are still 20–50 percent wider. This suggests that for the weakest credits in these sectors or those with the greatest exposure, the risks have not fully receded.
The Market Is Still Pricing in Tariff-Driven Weakness in the Tails
YTD Changes in HY Index SpreadsHigh
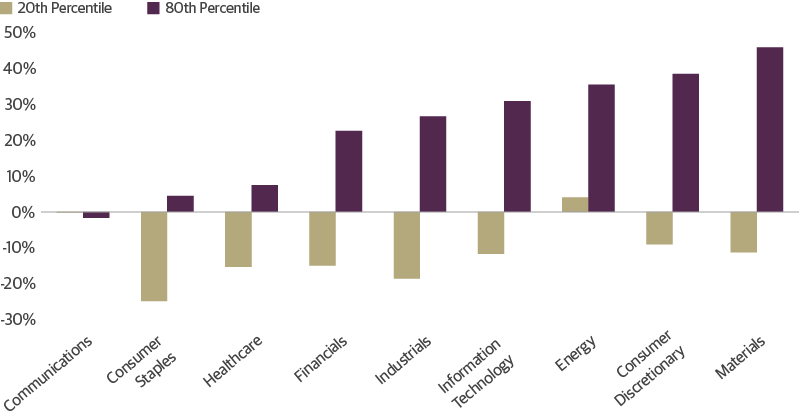
Source: Guggenheim Investments, Bloomberg. Data as of 5.12.2025.
It's important to note that fundamentals vary widely by capital structure and issuer type. The healthcare related issuers in high yield corporates, for example, are largely represented by large hospital systems with stable revenues. In contrast, the loan market skews toward smaller, labor-intensive providers still contending with staffing shortages and limited ability to pass through higher costs. Therefore, BB-rated healthcare industry spreads were the least affected component of the ICE BofA High Yield Index, but had the third largest move in the BB portion of the S&P UBS Leveraged Loan Index. With the recent introduction of the Trump administration’s efforts to lower drug prices, it is possible that even deeper bifurcations will arise. Similarly, not all consumer discretionary are equally exposed to tariff risks, and therefore showed opposite spread performance across bonds and loans. Understanding these critical differences is essential when assessing potential risk in this environment.
Spread Changes Highlight Tariff-Driven Nuances in Credit
YTD Changes in BB-Rated Bond and Loan Risk Premiums
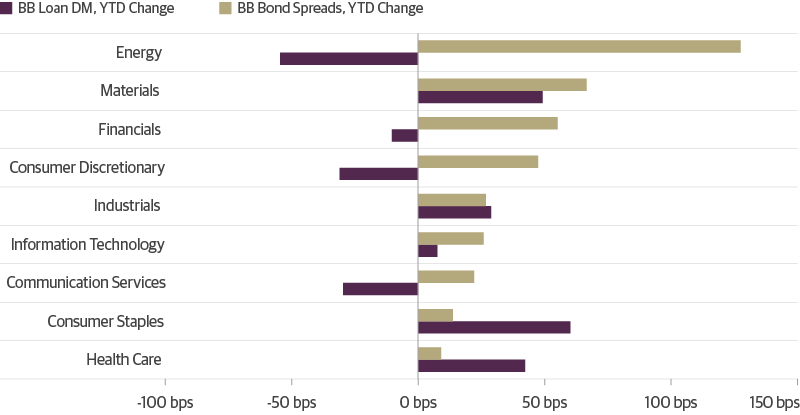
Source: Guggenheim Investments, Bloomberg. Data as of 5.6.2025.
Investment Implications: Stay Cautious as the Effects of Higher Policy Uncertainty May Still be Unclear
In an environment where headline risks remain, we are prioritizing quality while using the rally and spread narrowing to manage exposure to vulnerable credits.
We currently favor high yield corporates over bank loans given the sector’s higher quality credit profile which may help limit spread volatility. Conversely, we are cautious on bank loans. While the broad sector’s fundamentals look healthier compared to recent history, transparency is limited, creating a quality bias in visible loan data. Although we remain confident in the quality of our loan holdings, weakness in less visible issuers could still spill into the broader market.
We continue to actively monitor our portfolios, focusing on cost inflation, supply chain disruptions, and sourcing dependencies. In this environment, we favor higher quality issuers with pricing flexibility, negotiating power, diversified sourcing strategies, and strong management. In addition, we are maintaining dry powder to take advantage of relative value opportunities if spreads widen from here.
Leveraged Credit Scorecard
As of 3.31.2025
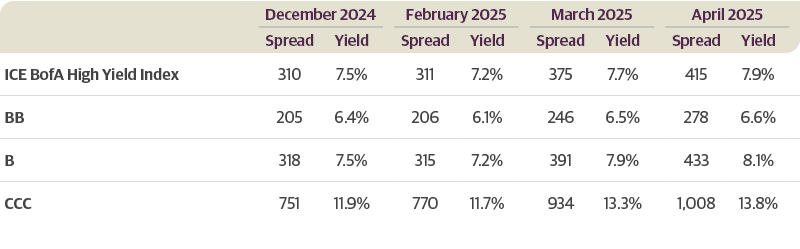
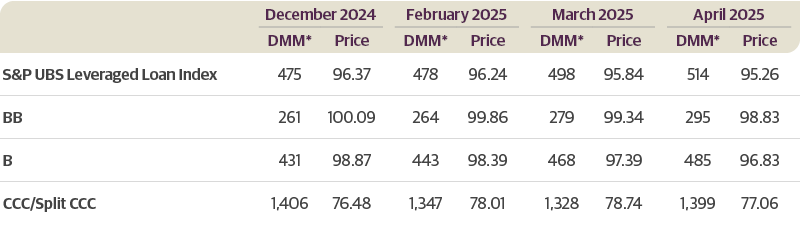
Source: ICE BofA, S&P UBS. *Discount Margin to Maturity assumes three-year average life. Past performance does not guarantee future results.
ICE BofA High Yield Index Returns
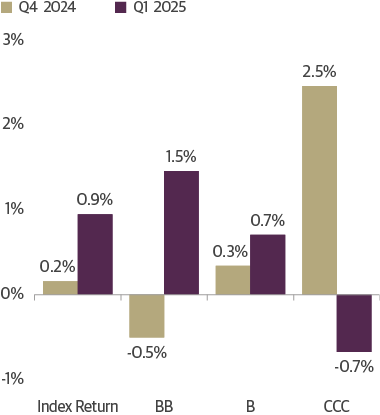
Source: ICE BofA. Data as of 3.31.2025. Past performance does not guarantee future results
S&P UBS Leveraged Loan Index Returns
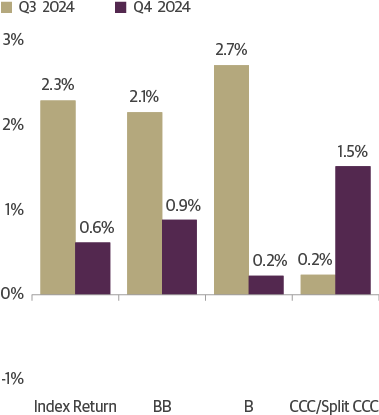
Source: S&P UBS. Data as of 3.31.2025. Past performance does not guarantee future results.
Important Notices and Disclosures
INDEX AND OTHER DEFINITIONS
The referenced indices are unmanaged and not available for direct investment. Index performance does not reflect transaction costs, fees or expenses.
The S&P UBS Leveraged Loan Index is designed to mirror the investable universe of the USD-denominated leveraged loan market. It consists of issues rated “5B” or lower, meaning that the highest rated issues included in this index are Moody’s/S&P ratings of Baa1/BB+ or Ba1/ BBB+. All loans are funded term loans with a tenor of at least one year and are made by issuers domiciled in developed countries.
The ICE BofA U.S. High Yield Index tracks the performance of US dollar denominated below investment grade corporate debt publicly issued in the US domestic market. Qualifying securities must have a below investment grade rating (based on an average of Moody’s, S&P and Fitch), at least 18 months to final maturity at the time of issuance, at least one year remaining term to final maturity as of the rebalancing date, a fixed coupon schedule and a minimum amount outstanding of $250 million. In addition, qualifying securities must have risk exposure to countries that are members of the FX-G10, Western Europe or territories of the US and Western Europe. The FX-G10 includes all Euro members, the U.S., Japan, the UK, Canada, Australia, New Zealand, Switzerland, Norway and Sweden.
A basis point (bps) is a unit of measure used to describe the percentage change in the value or rate of an instrument. One basis point is equivalent to 0.01 percent.
AAA is the highest possible rating for a bond. Bonds rated BBB or higher are considered investment grade. BB, B, and CCC-rated bonds are considered below investment grade and carry a higher risk of default, but offer higher return potential. A split bond rating occurs when rating agencies differ in their assessment of a bond.
The three-year discount margin to maturity (DMM), also referred to as discount margin, is the yield-to-refunding of a loan facility less the current three-month Libor rate, assuming a three year average life for the loan.
The interest coverage ratio is a debt and profitability ratio used to determine how easily a company can pay interest on its outstanding debt.
The leverage ratio is a metric that expresses how much of a company’s operations or assets are financed with borrowed money.
Spread is the difference in yield to a Treasury bond of comparable maturity.
Dry powder refers to highly liquid assets, such as cash or money market instruments, that can be invested when more attractive investment opportunities arise.
Investing involves risk, including the possible loss of principal. In general, the value of a fixed-income security falls when interest rates rise and rises when interest rates fall. Longer term bonds are more sensitive to interest rate changes and subject to greater volatility than those with shorter maturities. During periods of declining rates, the interest rates on floating rate securities generally reset downward and their value is unlikely to rise to the same extent as comparable fixed rate securities. High yield and unrated debt securities are at a greater risk of default than investment grade bonds and may be less liquid, which may increase volatility. Investors in asset-backed securities, including mortgage-backed securities and collateralized loan obligations (“CLOs”), generally receive payments that are part interest and part return of principal. These payments may vary based on the rate loans are repaid. Some asset-backed securities may have structures that make their reaction to interest rates and other factors difficult to predict, making their prices volatile and they are subject to liquidity and valuation risk. CLOs bear similar risks to investing in loans directly, such as credit, interest rate, counterparty, prepayment, liquidity, and valuation risks. Loans are often below investment grade, may be unrated, and typically offer a fixed or floating interest rate.
This article is distributed for informational or educational purposes only and should not be considered a recommendation of any particular security, strategy or investment product, or as investing advice of any kind. This article is not provided in a fiduciary capacity, may not be relied upon for or in connection with the making of investment decisions, and does not constitute a solicitation of an offer to buy or sell securities. The content contained herein is not intended to be and should not be construed as legal or tax advice and/or a legal opinion. Always consult a financial, tax and/or legal professional regarding your specific situation.
This article contains opinions of the author but not necessarily those of Guggenheim Partners or its subsidiaries. The author’s opinions are subject to change without notice. Forward-looking statements, estimates, and certain information contained herein are based upon proprietary and non-proprietary research and other sources. Information contained herein has been obtained from sources believed to be reliable, but are not assured as to accuracy. No part of this article may be reproduced in any form, or referred to in any other publication, without express written permission of Guggenheim Partners, LLC. Past performance is not indicative of future results. There is neither representation nor warranty as to the current accuracy of, nor liability for, decisions based on such information.
©2025, Guggenheim Partners, LLC. No part of this article may be reproduced in any form, or referred to in any other publication, without express written permission of Guggenheim Partners, LLC. Guggenheim Funds Distributors, LLC is an affiliate of Guggenheim Partners, LLC. For information, call 800.345.7999 or 800.820.0888.
Member FINRA/SIPC GPIM 65048
Tune in to Macro Markets to hear the top minds of Guggenheim Investments offer timely analysis on financial market trends. Guests include portfolio managers, fixed income sector heads, members of the Macroeconomic and Investment Research Group, and more.
Guggenheim Investments represents the investment management businesses of Guggenheim Partners, LLC ("Guggenheim"). Guggenheim Funds Distributors, LLC is an affiliate of Guggenheim.
Read a prospectus and summary prospectus (if available) carefully before investing. It contains the investment objective, risks charges, expenses and the other information, which should be considered carefully before investing. To obtain a prospectus and summary prospectus (if available) click here or call 800.820.0888.
Investing involves risk, including the possible loss of principal.
Guggenheim Investments represents the following affiliated investment management businesses of Guggenheim Partners, LLC: Guggenheim Partners Investment Management, LLC, Security Investors, LLC, Guggenheim Funds Distributors, LLC, Guggenheim Funds Investment Advisors, LLC, Guggenheim Corporate Funding, LLC, Guggenheim Wealth Solutions, LLC, Guggenheim Private Investments, LLC, Guggenheim Investments Loan Advisors, LLC, Guggenheim Partners Europe Limited, Guggenheim Partners Japan Limited, and GS GAMMA Advisors, LLC.
This is not an offer to sell nor a solicitation of an offer to buy the securities herein. GCIF 2019 and GCIF 2016 T are closed for new investments.
©
Guggenheim Investments. All rights reserved.
Research our firm with FINRA Broker Check.
Not FDIC Insured • No Bank Guarantee • May Lose Value
This website is directed to and intended for use by citizens or residents of the United States of America only. The material provided on this website is not intended as a recommendation or as investment advice of any kind, including in connection with rollovers, transfers, and distributions. Such material is not provided in a fiduciary capacity, may not be relied upon for or in connection with the making of investment decisions, and does not constitute a solicitation of an offer to buy or sell securities. All content has been provided for informational or educational purposes only and is not intended to be and should not be construed as legal or tax advice and/or a legal opinion. Always consult a financial, tax and/or legal professional regarding your specific situation. Investing involves risk, including the possible loss of principal.
By choosing an option below, the next time you return to the site, your home page will automatically
be set to this site. You can change your preference at any time.
We have saved your site preference as
Institutional Investors. To change this, update your
preferences.
United States Important Legal Information
By confirming below that you are an Institutional Investor, you will gain access to information on this website (the “Website”) that is intended exclusively for Institutional Investors and, as such, the information should not be relied upon by individual investors. This Website and any product, content, information, tools or services provided or available through the Website (collectively, the “Services”) are provided to Institutional Investors for informational purposes only and do not constitute a recommendation to buy or sell any security or fund interest. Nothing on the Website shall be considered a solicitation for the offering of any investment product or service to any person in any jurisdiction where such solicitation or offering may not lawfully be made. By accessing this Website, you expressly acknowledge and agree that the Website and the Services provided on or through the Website are provided on an as is/as available basis, and except as partnered by law, neither Guggenheim Investments and it parents, subsidiaries and affiliates nor any third party has any responsibility to maintain the website or the Services offered on or through the Website or to supply corrections or updates for the same. You understand that the information provided on this Website is not intended to provide, and should not be relied upon for, tax, legal, accounting or investment advice. You also agree that the terms provided herein with respect to the access and use of the Website are supplemental to and shall not void or modify the Terms of Use in effect for the Website. The information on this Website is solely intended for use by Institutional Investors as defined below: banks, savings and loan associations, insurance companies, and registered investment companies; registered investment advisers; individual investors and other entities with total assets of at least $50 million; governmental entities; employee benefit (retirement) plans, or multiple employee benefit plans offered to employees of the same employer, that in the aggregate have at least 100 participants, but does not include any participant of such plans; member firms or registered person of such a member; or person(s) acting solely on behalf of any such Institutional Investor.
By clicking the "I confirm" information link the user agrees that: “I have read the terms detailed and confirm that I am an Institutional Investor and that I wish to proceed.”