High Yield and Bank Loan Outlook
Fourth Quarter 2025
Credit markets remained steady through the fall, supported by resilient growth and improving sentiment following the April tariff policy shock. Year-to-date returns for both high yield and loans have been strong, with high yield generating additional performance from falling interest rates. These results leave both high yield bond spreads and leveraged loan discount margins near historical tights.
Looking ahead, Federal Reserve (Fed) rate cuts will likely impact relative value across leveraged credit. While easing would support overall credit conditions, it could compress loan yields, reducing the sector’s carry advantage over high yield bonds. Fundamental challenges in the lowest quality loan borrowers seem likely to persist in 2026 even as funding costs decline. Against this backdrop, we continue to have a higher quality bias and favor active credit selection.
Report Highlights:
- High yield bonds and bank loans have delivered positive returns this year, as strong demand and limited supply have compressed spreads.
- Bonds outperformed bank loans due to lower credit losses and a modest tailwind from declining Treasury yields. In contrast, repricing and defaults have eroded loans’ yield advantage.
- Additional Fed rate cuts over the next year and ongoing loan repricing activity could shift relative value toward bonds, particularly for retail investors. Careful credit selection remains important, as challenging conditions persist for some borrowers.
- We believe active strategies are best positioned to navigate credit dispersion and shifting relative value. We expect high yield bonds to deliver coupon-like returns near 6.5 percent over the next year.
Macroeconomic Outlook
Resilient Growth Despite Uneven Momentum
The U.S. economy has been resilient this year to a shifting policy environment. Growth recovered from first quarter lows and looks robust in the third quarter, driven by consumer spending and strong technology investment.
However, economic growth continues to be characterized by meaningful bifurcation. Sentiment has diverged sharply across consumer cohorts, as higher income households benefit from rising financial wealth, while lower income households are squeezed by high interest rates and moderating real income gains. For businesses, AI-driven technology investment continues to surge, while other areas of business and housing investment languish. Companies remain cautious, and the labor market has settled into a “low hire, no fire” pattern creating vulnerability to new shocks.
The U.S. government shutdown represented a new challenge for the economy and will weigh on fourth quarter growth. The lapse in data from the shutdown reduces visibility into economic conditions at a transitional moment. Alternative, private data sources paint a picture of a mostly stable private jobs market. Although the economy should recover as the government reopens, risks are tilted to the downside, in particular, if the shutdown weakens sentiment or hiring further.
Tariff-driven inflation has been less pronounced than initially feared. Strong corporate profitability in some sectors has allowed firms to absorb higher import costs, while others are passing through price increases gradually, prolonging the adjustment process. We expect these effects to fade by the second half of 2026, allowing the Fed to continue lowering the policy rate to around 3 percent.
Overall, we see a constructive backdrop for credit markets. Our base case is for moderate growth and cooling inflation in 2026, with the Fed easing back toward neutral. Risks are tilted to the downside, in particular if the labor market cools more sharply or a shift in investor sentiment sparks a pullback in financial markets.
High Income Consumers Are Feeling Good from Wealth Gains
Morning Consult Sentiment by Household Income, 20-Day Moving Average
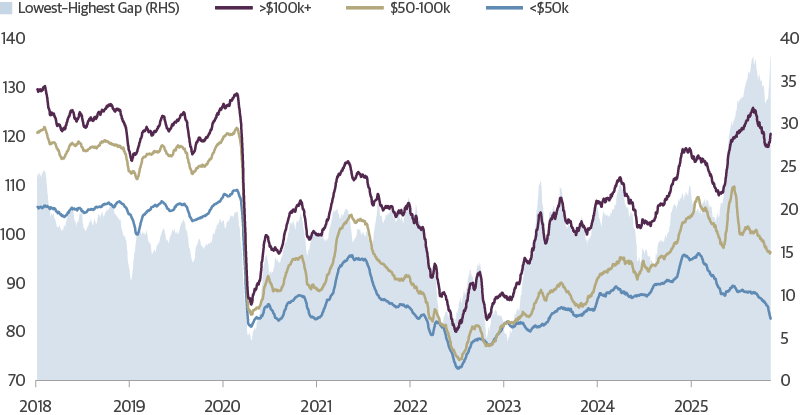
Source: Guggenheim Investments, Bloomberg. Data as of 11.6.2025.
Leveraged Credit Review
Bonds Outperform Loans this Year
Both bonds and loans have delivered positive returns in 2025, benefitting from strong demand tailwinds and limited supply. Bonds outperformed at every rating level as a moderate default cycle limited credit losses.
Despite entering the year with higher starting yields, the loan market has struggled to translate income advantage into realized performance due to repricing activity and persistent challenges among the lowest quality borrowers. Repricing activity is when a borrower and its lenders amend an existing loan so that the margin (i.e. spread) over the benchmark is lowered, which can reflect an improvement in the borrower’s credit quality or in the current market, supply/demand conditions. Usually other terms of the loan, such as the maturity date, are unchanged in repricing activity. At the index level, loans underperformed bonds by almost 2.5 percentage points, with underperformance particularly stark further down the credit spectrum.
Loans Have Lagged High Yield Bond Returns This Year
Cumulative Return Since 12.31.2024
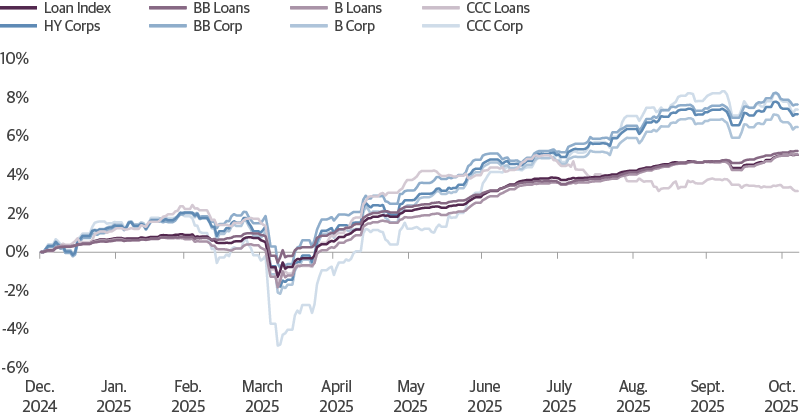
Source: Guggenheim Investments, Bloomberg, S&P UBS, ICE Index Services. Data as of 11.5.2025.
Repricings and Credit Losses Weigh on Loan Returns
For higher quality loans, repricing activity moderated returns. Loan amendments reduced spreads by an average of 51 basis points year to date, as lenders refinance stronger credits at tighter risk premiums. With roughly 40 percent of the index still trading above par and another 35 percent between 98–100 percent of par, repricing activity could persist. This is because when loans trade at or above par, it indicates that investor demand for certain loans exceeds available supply of them, in this case being higher quality loans. As a result, investors are willing to pay more than the loan’s face value, which reduces their all-in yield. This dynamic typically signals to borrowers that investors may be willing to accept a lower contractual spread in order to hold the loan.
At the lower end of the credit quality spectrum, defaults and credit losses have eroded loan returns. Credit losses in the sector were about 1.1 percent in year to date, compared to 0.4 percent for bonds. Defaults and liability management exercises have spanned industries. The common thread in the activity has tended to be structural rather than industry-driven, concentrated among lower rated and more leveraged borrowers, typically in loan-only structures with no subordinated debt to absorb losses. And while credit stress remains concentrated in CCCs, which make up just 7 percent of the loan market, the combined effect of repricing at the top end and higher defaults at the bottom has hindered performance in the loan market.
Leveraged Credit Outlook
Higher Credit Quality and Declining Policy Rates Favor High Yield at the Index Level
Looking ahead, declining policy rates and a moderate default cycle may further weigh on index-level loan returns relative to bonds. Although lower rates may provide some relief to select loan borrowers, the extent of rate reductions appears insufficient to meaningfully improve outcomes for the majority. As a result, careful credit selection will be essential to achieve the best returns.
Ongoing Moderate Default Cycle May Continue to Erode Loan Returns
Loan yields near 8 percent offer 100 basis points over high yield bonds, but most of that advantage reflects the loan market’s heavier concentration in lower rated credits. The largest yield differences are in the lowest ratings—with CCC loans offering an over 8 percent premium to bonds—reflecting higher default and downgrade risk in the loan market. Diving deeper, the areas where we see the most yield premium in loans over bonds are in technology, healthcare, and certain consumer sectors in particular among credits facing secular headwinds or softening demand. Current index yields therefore don’t offer a clear advantage to loans at the index level, given the default and repricing risk.
Loans Still Offer a Yield Advantage Over Corporate Bonds…
High Yield Bond and Leveraged Loan Yields
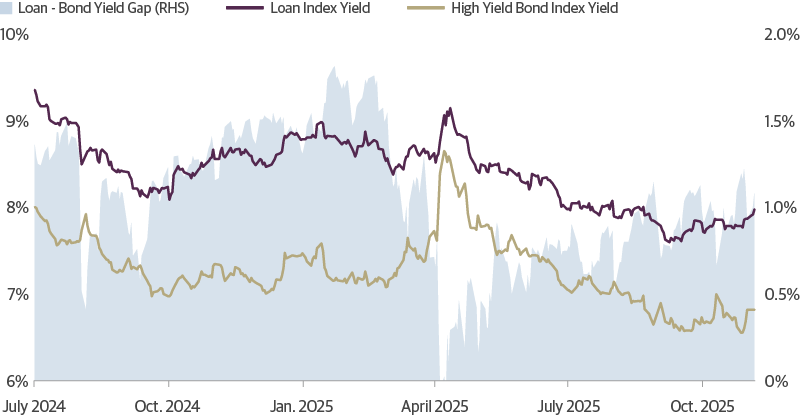
Source: Guggenheim, Bloomberg, S&P UBS, ICE Index Services. Data as of 11.5.2025.
…That Advantage Narrows Once Controlling for Quality Differences
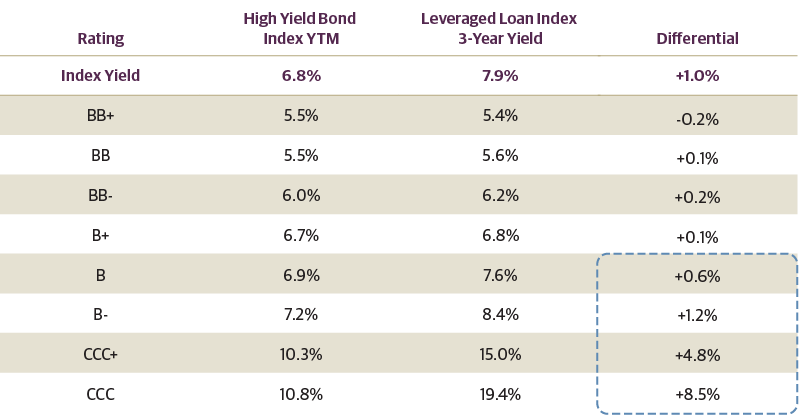
Source: Guggenheim, Bloomberg, S&P UBS, ICE Index Services. Data as of 11.5.2025.
Retail Flows into Loans Could Wane, Even as Institutional Demand Remains Robust
We anticipate lower retail demand for loans in 2026 but expect institutional demand to remain robust. Retail flows into mutual funds and ETFs have already been negative this year, with roughly $6 billion in outflows year to date through October, and rate cuts could accelerate that trend.
However, collateralized loan obligations (CLOs) account for roughly 70 percent of loan demand. As their liability costs fall, the spread between asset yields and funding costs should be maintained. CLO issuance hit record highs this year as the largely AAA-rated structure appealed to institutional investors with a need to stay high in quality, and we expect this to continue.
The backdrop for other institutional investors remains positive. In 2027, changes to capital requirements for European insurance companies could expand the institutional buyer base for U.S. AAA CLOs, with foreign investors likely assessing the opportunity next year. Separately managed accounts (SMAs) also tend to be stickier because of their longer time horizon for allocation changes.
Rate Cuts Are Unlikely to Address Credit Challenges for Lower Quality Borrowers
In terms of credit fundamentals, we do not expect Fed rate cuts to materially improve conditions for many lower-quality loan issuers, creating an environment that favors careful credit selection. Prior to 2020, leverage ratios for B-rated borrowers were typically 5–6x earnings before interest, taxes, depreciation, and amortization (EBITDA), with coverage of about 2.5x. Today, many B-rated borrowers have debt equaling 7x EBITDA, with only a 2x interest coverage ratio. For those borrowers, interest coverage would improve only modestly to roughly 2.4x if the Fed lowers its policy rate to 3 percent.
Highly levered capital structures explain the rise of liability management exercises, as sponsors look to extract value from lenders. Many of today’s loans were originated in 2021, when company valuations averaged 9–10x earnings. With valuations now closer to 8x, sponsors face a more challenging exit environment, which has left many private equity owners incentivized to pursue amendments and exchanges that improve capital structure flexibility, often at lenders’ expense. Liability management exercise activity seems likely to persist into 2026, particularly among smaller and lower-rated credits. The key swing factor for 2026 will be the trajectory of EBITDA growth—stronger corporate performance could stabilize defaults, while flat earnings would keep credit losses near or above 1 percent. Even so, defaults remain concentrated among smaller, highly leveraged issuers, and stronger companies continue to maintain healthy access to financing. This should help limit broader contagion and keep the overall credit backdrop manageable.
Rates Cuts Could Modestly Boost Interest Coverage Ratios
Impact Analysis for a Floating-Rate Borrower with 7x Leverage and 2x Interest Coverage
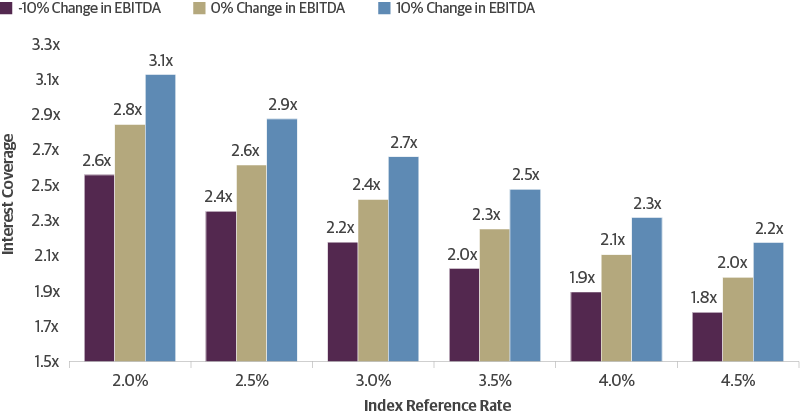
Source: Guggenheim Investments, Bloomberg, S&P UBS. Data as of 10.31.2025.
Investment Implications
Stay Selective and Up in Quality as Value Shifts
Although loans still offer a carry advantage over high yield bonds, the key for investors is to navigate repricing activity and avoid pockets of credit weakness. In the current environment of tight spreads, we continue to favor higher quality credits and careful credit selection. Downgrades in the loan market continue to outnumber upgrades, signaling ongoing strain among lower-rated issuers, while rating actions in high yield have remained more balanced. We expect high yield bonds to deliver coupon-like returns near 6.5 percent over the next year, remaining attractive compared to the last 10 years’ average. We also favor active selection of loan credits to take advantage of elevated yields and help protect against downside risks.
Leveraged Credit Scorecard
As of 9.30.2025
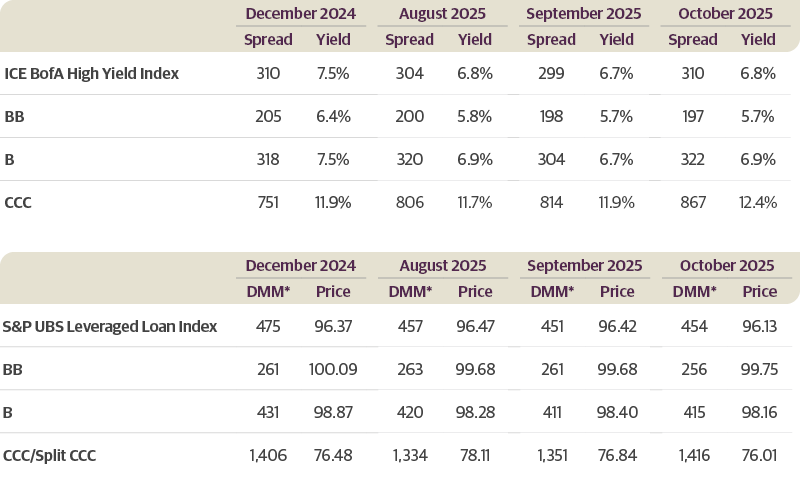
Source: ICE BofA, S&P UBS. *Discount Margin to Maturity assumes three-year average life. Past performance does not guarantee future results.
ICE BofA High Yield Index Returns
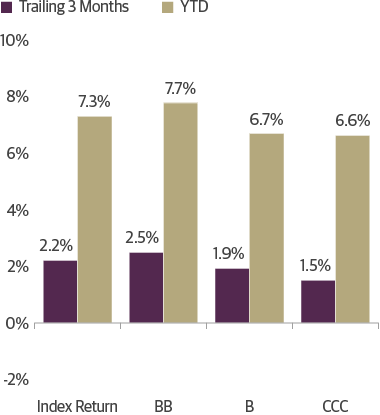
Source: ICE BofA. Data as of 9.30.2025. Past performance does not guarantee future results
S&P UBS Leveraged Loan Index Returns
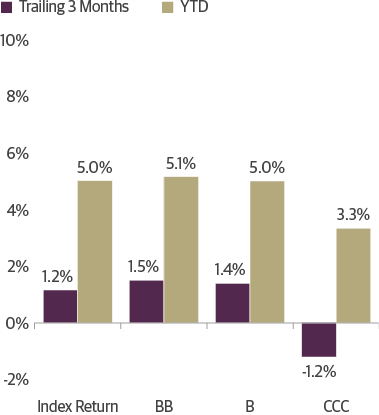
Source: S&P UBS. Data as of 9.30.2025. Past performance does not guarantee future results.
Important Notices and Disclosures
INDEX AND OTHER DEFINITIONS
The referenced indices are unmanaged and not available for direct investment. Index performance does not reflect transaction costs, fees or expenses.
The S&P UBS Leveraged Loan Index is designed to mirror the investable universe of the USD-denominated leveraged loan market. It consists of issues rated “5B” or lower, meaning that the highest rated issues included in this index are Moody’s/S&P ratings of Baa1/BB+ or Ba1/ BBB+. All loans are funded term loans with a tenor of at least one year and are made by issuers domiciled in developed countries.
The ICE BofA U.S. High Yield Index tracks the performance of US dollar denominated below investment grade corporate debt publicly issued in the US domestic market. Qualifying securities must have a below investment grade rating (based on an average of Moody’s, S&P and Fitch), at least 18 months to final maturity at the time of issuance, at least one year remaining term to final maturity as of the rebalancing date, a fixed coupon schedule and a minimum amount outstanding of $250 million. In addition, qualifying securities must have risk exposure to countries that are members of the FX-G10, Western Europe or territories of the US and Western Europe. The FX-G10 includes all Euro members, the U.S., Japan, the UK, Canada, Australia, New Zealand, Switzerland, Norway and Sweden.
A basis point (bps) is a unit of measure used to describe the percentage change in the value or rate of an instrument. One basis point is equivalent to 0.01 percent.
AAA is the highest possible rating for a bond. Bonds rated BBB or higher are considered investment grade. BB, B, and CCC-rated bonds are considered below investment grade and carry a higher risk of default, but offer higher return potential. A split bond rating occurs when rating agencies differ in their assessment of a bond.
The three-year discount margin to maturity (DMM), also referred to as discount margin, is the yield-to-refunding of a loan facility less the current three-month Libor rate, assuming a three year average life for the loan.
The interest coverage ratio is a debt and profitability ratio used to determine how easily a company can pay interest on its outstanding debt.
The leverage ratio is a metric that expresses how much of a company’s operations or assets are financed with borrowed money.
Spread is the difference in yield to a Treasury bond of comparable maturity.
Carry is the difference between the cost of financing an asset and the interest received on that asset.
EBITDA stands for earnings before interest, taxes, depreciation, and amortization.
Dry powder refers to highly liquid assets, such as cash or money market instruments, that can be invested when more attractive investment opportunities arise.
Investing involves risk, including the possible loss of principal. In general, the value of a fixed-income security falls when interest rates rise and rises when interest rates fall. Longer term bonds are more sensitive to interest rate changes and subject to greater volatility than those with shorter maturities. During periods of declining rates, the interest rates on floating rate securities generally reset downward and their value is unlikely to rise to the same extent as comparable fixed rate securities. High yield and unrated debt securities are at a greater risk of default than investment grade bonds and may be less liquid, which may increase volatility. Investors in asset-backed securities, including mortgage-backed securities and collateralized loan obligations (“CLOs”), generally receive payments that are part interest and part return of principal. These payments may vary based on the rate loans are repaid. Some asset-backed securities may have structures that make their reaction to interest rates and other factors difficult to predict, making their prices volatile and they are subject to liquidity and valuation risk. CLOs bear similar risks to investing in loans directly, such as credit, interest rate, counterparty, prepayment, liquidity, and valuation risks. Loans are often below investment grade, may be unrated, and typically offer a fixed or floating interest rate.
This article is distributed for informational or educational purposes only and should not be considered a recommendation of any particular security, strategy or investment product, or as investing advice of any kind. This article is not provided in a fiduciary capacity, may not be relied upon for or in connection with the making of investment decisions, and does not constitute a solicitation of an offer to buy or sell securities. The content contained herein is not intended to be and should not be construed as legal or tax advice and/or a legal opinion. Always consult a financial, tax and/or legal professional regarding your specific situation.
This article contains opinions of the author but not necessarily those of Guggenheim Partners or its subsidiaries. The author’s opinions are subject to change without notice. Forward-looking statements, estimates, and certain information contained herein are based upon proprietary and non-proprietary research and other sources. Information contained herein has been obtained from sources believed to be reliable, but are not assured as to accuracy. No part of this article may be reproduced in any form, or referred to in any other publication, without express written permission of Guggenheim Partners, LLC. Past performance is not indicative of future results. There is neither representation nor warranty as to the current accuracy of, nor liability for, decisions based on such information.
©2025, Guggenheim Partners, LLC. No part of this article may be reproduced in any form, or referred to in any other publication, without express written permission of Guggenheim Partners, LLC. Guggenheim Funds Distributors, LLC is an affiliate of Guggenheim Partners, LLC. For information, call 800.345.7999 or 800.820.0888.
Member FINRA/SIPC GPIM 66820