Corporate Credit Quarterly
First Quarter 2026
Overall, we see a positive backdrop for corporate credit in 2026. Solid U.S. economic growth, broadening corporate profitability, and easing inflationary pressures should benefit corporate fundamentals, which are supportive for expected returns. However, performance dispersion is likely to increase as the impact of artificial intelligence (AI) continues to be priced into the markets in different ways. While mostly impacting equity valuations for now, this will also continue to have a rolling impact on certain industries and issuers. What started as a capital expenditure (capex) story is now moving into questions about longer term disintermediation and disruption. Winners and losers will begin to emerge, and active risk management, along with diversification, are prudent mitigants.
U.S. corporations have entered a re-leveraging cycle that will likely gain momentum this year. Mergers and acquisitions (M&A) activity is rising (although subject to favorable market conditions), and investment tied to AI is accelerating. Together these forces could drive a record year of credit issuance in corporate bonds and loans. While this should produce attractive new investment opportunities, it will likely lead to modest spread widening and credit curve steepening as the market absorbs elevated supply.
With spreads historically tight, active sector and issuer selection will be essential to generate excess returns. We are focused on quality and diversification across portfolios, favoring credits with secure and stable revenue streams, while remaining nimble to capitalize on opportunities as the AI narrative and supply dynamics evolve throughout the year.
Report Highlights:
- Corporate profitability is broadening—small-cap earnings turned positive in Q3 2025 after nine quarters of contraction.
- U.S. corporations have entered a re-leveraging cycle, with 2026 poised to be a record year for credit issuance driven by M&A and AI investment.
- Despite the supply surge, fundamentals remain solid: median net leverage is contained at 1.8x for investment-grade bonds and 3.2x for high yield bonds.
- With spreads historically tight, active sector and issuer selection will be essential to generate excess returns.
Macroeconomic Update
An Economy on a Path Toward Equilibrium
The first half of 2026 is poised for strong economic growth, supported by fiscal tailwinds from provisions in the One Big Beautiful Bill Act (OBBBA) and ongoing AI investment. As the fiscal impulse fades in the second half, real gross domestic product growth should settle near 2 percent and residual price pressures should begin to decline. The labor market remains a key downside risk that we are monitoring, but our base case is that broadening growth stabilizes employment.
With the midterm elections approaching, we anticipate continued policy shifts at the sector level to address voters’ affordability concerns. For example, January’s directive for Fannie Mae and Freddie Mac to purchase $200 billion in mortgage-backed securities brought down mortgage spreads. Not every sector will benefit: Healthcare and pharmaceuticals are facing scrutiny, with the administration pursuing executive orders aimed at lowering drug prices. For credit investors, sector level exposure to policy risks requires attention.
Technological disruption is also reshaping the investment landscape. We see 2026 as an inflection point for AI, with continued innovation demonstrating the disruptive potential of this new technology. Business adoption is accelerating rapidly, with over 80 percent of firms now using AI in at least one function. We expect industries including healthcare, agriculture, and food services to leverage these capabilities for efficiency and innovation. At the same time, disruption is evident as per-seat licensing models face pressure from agent-based AI tools, impacting valuations in software, legal services, and payments infrastructure. Winners will be firms that successfully scale and realize tangible gains. Laggards may face competitive and valuation pressures.
Lower macroeconomic policy volatility and solid economic growth provide a stable overall backdrop for credit, even as industry-specific disruption emerges. One key variable to watch is the impact of increased supply, which could modestly widen spreads as it tests the market’s absorptive capacity. An environment of technological and policy shifts will also increase the importance of sector and security selection for returns.
Overall, we see a constructive backdrop for credit markets. Our base case is for moderate growth and cooling inflation in 2026, with the Fed easing back toward neutral. Risks are tilted to the downside, in particular if the labor market cools more sharply or a shift in investor sentiment sparks a pullback in financial markets.
Corporate Credit Review
Expanding Profit Growth and Stable Leverage Create a Constructive Fundamental Backdrop for Credit in 2026
After several years of bifurcated growth, earnings began to broaden in 2025—a trend we expect will continue in 2026. Early in the year, profitability remained heavily skewed toward larger companies, but smaller company earnings inflected higher in the third quarter, turning positive after nine consecutive quarters of contraction. Overall, the S&P 500 delivered above average EPS growth of 13 percent. Looking ahead, analyst expectations point to broadening macroeconomic growth and lower rates to support continued earnings expansion, with large and small cap segments potentially seeing similar profit growth of around 15 percent in 2026.
Solid Earnings Growth Underpins Healthy Credit Fundamentals
Large Cap vs. Small Cap Last 12 Months Earnings per Share Year over Year %
.png.aspx)
Source: Guggenheim Investments, Factset, S&P Dow Jones Indices. Data as of 1.31.2026.
Despite this solid earnings growth in 2025, corporate management teams remained cautious as policy uncertainty rose. As a result, they have contained median leverage across both investment grade and high yield corporate bond issuers. In investment grade, median net leverage has averaged 1.7x since 2021 and stood at 1.8x as of the third quarter of 2025. In high yield, the median leverage ratio is only modestly above the five-year average, at 3.2x compared to 3.0x. Rising profitability alongside stable leverage creates a constructive backdrop for credit in 2026.
Dispersion, however, remains elevated. Pockets of stress persist among lower quality credits, particularly in loans rated B- and CCC, where issuers carrying leverage of 6x or higher are restructuring balance sheets that proved unsustainable in a higher rate environment. More recently, the loan market’s 16 percent exposure to software has come under scrutiny. Investors are pricing in AI-disruption risk, potentially leading to additional downgrades and defaults in the sector and adding another percentage point to the overall default rate. Second-order effects have also materialized in investment-grade rated debt of business development companies, where spreads have widened about 40 basis points this year, and we are watching any other spillovers
Net Leverage Ratios Are Holding Steady
Sector Median Net Leverage
.png.aspx)
Source: Guggenheim Investments, Morgan Stanley Research. Data as of 9.30.2025.
Beyond these pressures, however, the broader credit universe shows few signs of strain. The benign default and rating migration environment gives corporate borrowers capacity to take on more leverage should attractive investment opportunities emerge, potentially supporting further credit activity this year.
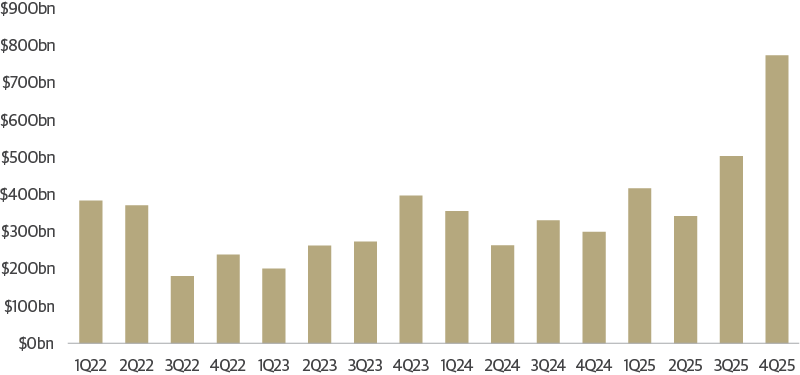
Corporate Credit Supply Could Reach Record Levels in 2026
After years of sluggish credit growth, a confluence of factors is now creating strong incentives for a surge in corporate credit supply in 2026. Tax incentives under the OBBBA have improved the economics of capital deployment, while the clearing of U.S. macroeconomic uncertainty has given corporate boards greater confidence to act. M&A activity has risen across technology, industrials, energy, utilities, and healthcare, with U.S. deal volumes reaching nearly $800 billion in the fourth quarter of 2025 alone and $2 trillion for the full year. Meanwhile, the AI investment cycle is pulling hyperscalers and their supply chains into the debt markets at scale, with U.S. capex set to reach record levels in 2026.
At the lower end of the credit quality spectrum, defaults and credit losses have eroded loan returns. Credit losses in the sector were about 1.1 percent in year to date, compared to 0.4 percent for bonds. Defaults and liability management exercises have spanned industries. The common thread in the activity has tended to be structural rather than industry-driven, concentrated among lower rated and more leveraged borrowers, typically in loan-only structures with no subordinated debt to absorb losses. And while credit stress remains concentrated in CCCs, which make up just 7 percent of the loan market, the combined effect of repricing at the top end and higher defaults at the bottom has hindered performance in the loan market.
M&A Deals Have Accelerated
U.S. M&A Transaction Volumes
Source: Guggenheim, Bloomberg. Includes completed and pending deals. Data as of 2.11.2026. Value represents equity plus net debt in non-financial deals, and equity in financial deals.
Investment-grade corporate bond issuance is off to a very strong start this year with January issuance totaling $217 billion—a record for the month and the fifth-largest month historically. This momentum continued into February. Large technology issuers have been at the forefront, with recent transactions from Oracle ($25 billion) and Alphabet ($20 billion), and more issuance likely from Amazon, Meta, and Apple.
January IG Debt Issuance Was Very Strong
January IG Debt Issuance Was Very Strong
.png.aspx)
Source: Guggenheim Investments, BofA Global Research, JP Morgan Research. Uses the average of JPM and BofA data. Data as of 1.31.2026.
Estimates for AI-related capital spending continue to rise. During the Q4 earnings season, hyperscalers announced enormous increases to their 2026 capital expenditure plans, pushing median analyst consensus expectations from $535 billion to $670 billion. Importantly, the AI investment cycle extends well beyond hyperscalers. Data center operators, power-adjacent infrastructure companies, and utilities expanding generation and grid capacity are also expected to tap debt markets.
Although longer-term risks exist as the AI buildout scales, the strong fundamentals of diversified hyperscalers support higher debt levels. Hyperscalers generated $340 billion in free cash flow over the last 12 months and maintain low average net debt of just 0.8x EBITDA. Excluding Oracle, average net debt is negative 0.1x, given that Google and Apple have more liquid assets than debt outstanding. Robust profit growth should help keep leverage ratios in check, even as borrowing increases.
Credit Supply Expected to See a Large Increase this Year
Net Corporate Bond Issuance and 2026 Expected Issuance
.png.aspx)
Source: Guggenheim Investments, BofA Merrill Lynch Global Research, Morgan Stanley Research, JP Morgan Research. Annual figures reflect the average of the three banks. Data as of 1.31.2026.
Taken together, dealers expect net supply of investment grade and high yield bonds and bank loans to grow 30 percent in 2026. Investment-grade corporate bond net issuance alone is forecast to range from $670 billion to $1 trillion, the top end of that range would set a record for the sector. We think credit and macro conditions are aligned to see these strong expectations realized this year. When combined with another $400–$450 billion in leveraged credit and potential issuance from private debt markets, 2026 is shaping up to be a year of materially higher credit supply for investors to absorb.
Strong Demand Is Likely to Absorb Issuance, but Spreads Could Widen and Steepen
Demand has been strong enough to absorb record issuance to start the year. Investment-grade corporate bond deals have been roughly four times oversubscribed on average, even amid record gross issuance volumes. With all-in yields still attractive relative to most other advanced economies, demand for U.S. credit remains strong. However, there is some risk that spreads will start to widen as investors make room for increased supply.
AI-related issuance is skewing longer in maturity than typical corporate bond issuance. These issuers tend to have lower credit spreads at short tenors because of their high credit quality. However, beyond the 11-year point on the credit curve, spread pricing for AI-related bonds becomes much more dispersed.
More Long-Dated AI Issuance Could Mechanically Widen Index Spreads
IG Spread Curves, AI vs Non-AI Names
Source: Guggenheim Investments, Bloomberg, ICE Index Services. Data as of 2.12.2026.
This matters because long-dated corporate bonds attract a more concentrated buyer base—predominantly pension funds and life insurers seeking to match long-duration liabilities. In recent years issuance has generally skewed shorter, meaning a surge in supply at the long end would test this segment’s absorptive capacity in ways the market has not experienced recently. The investment-grade credit curve currently offers only about 40 basis points between short- and long-dated spreads, flatter than historical norms, leaving room to steepen as the market absorbs this duration.
Pricing is also likely to remain dispersed, creating opportunities for active managers to differentiate among credits. AI-related issuers tend to have lower credit spreads at short tenors because of their high credit quality. However, beyond the 11-year point on the credit curve, spread pricing for AI-related bonds becomes much more dispersed, reflecting the market’s evolving view of these credits and differentiation of their risk.
Dispersion could also increase among corporate credits as investors assess risks to individual issuers’ ability to navigate AI-related disruption. The speed of technological advancement and scale of investment has prompted investors to scrutinize more deeply companies’ ability to monetize capex spending. Sentiment can also shift quickly for non-AI related companies as the capabilities of AI to disrupt or benefit industries or companies become clear. Elevated supply and rising dispersion will reward selectivity, while passive exposure to the market may leave portfolios vulnerable to pockets of weakness. Quality and diversification should be the guiding principles under a rigorous credit selection process.
Overall, the combination of healthy balance sheets, solid earnings growth, and sustained investor appetite for yield should allow the market to digest record issuance while maintaining a supportive environment for credit.
Investment Takeaways: Lean Into Quality and Diversification
- The macroeconomic backdrop is supportive of credit. Strong corporate fundamentals and high all-in yields create attractive carry. As the economy moves toward equilibrium and policy volatility moderates, the environment remains constructive for credit performance.
- Historically tight spreads make active management critical to delivering excess returns. Our investment process favors well-secured, high-quality credits across industries, with a focus on diversification and stable revenue streams. This keeps us cautious on industries facing AI disruption, such as small tech software and services issuers, particularly in the loan market, and areas challenged by a bifurcated consumer. We find favorable risk/reward in sectors benefiting from healthy credit fundamentals, such as banks.
- Selectivity will be key as supply grows. Seeking returns outside crowded themes and adding risk at wider spread levels should drive better outcomes. As dispersion between winners and losers grows, weaker credits will face elevated downgrades and default risk, underscoring the importance of maintaining a disciplined quality bias.
Corporate Credit Market Performance
Credit has delivered solid performance over the past year, driven by coupon income, some spread compression, and modest benchmark rate declines. Credit quality pressures persist in CCC-rated debt, where default activity is concentrated. Looking ahead, investors should anticipate coupon-like returns, given our view that rates will remain rangebound and spreads could modestly widen. We expect rangebound all-in yields, with benchmark rates likely stable and spreads already tight by historical standards, leaving limited room for further compression. Although loans are starting from better valuations, we expect the sector’s default activity to remain above average which would erode some of the yield. Consequently, spread tightening is unlikely to meaningfully boost total returns, but active positioning can find strong opportunities for alpha.
Corporate Credit Performance Statistics—Yields, Total Returns, Default Rates and Net Rating Migration
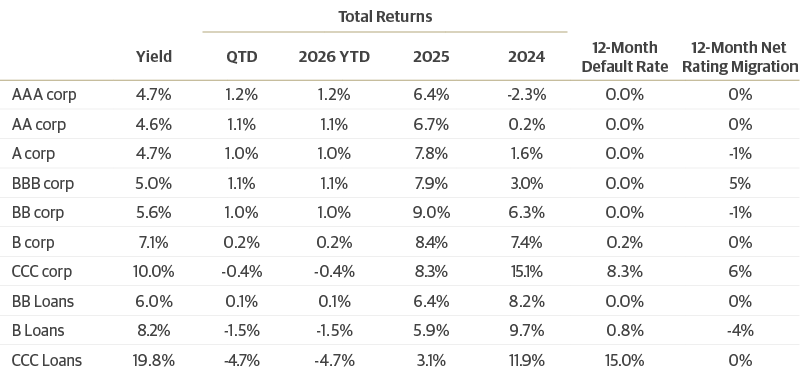
Source: Guggenheim Investments, Bloomberg, S&P Creditpro, S&P Dow Jones Indices, UBS. Yields and total returns as of 3.2.2026. Corporate bond yields are yield to worst, bank loan yields are 3-year yields, which assumes the loan is repaid or refinanced in 3 years. Net rating migration and default rates as both issuer-weighted and as of 1.31.2026. Net rating migration is calculated as the share of instruments in each sector rated by S&P that were upgraded minus the share of instruments that were downgraded.
Large Cap vs. Small Cap Last 12 Months Earnings per Share Year over Year %
Guggenheim Investments, Bloomberg, S&P Dow Jones Indexes, UBS. Data as of 3.2.2026. Past performance does not guarantee future results.
Important Notices and Disclosures
INDEX AND OTHER DEFINITIONS
The referenced indices are unmanaged and not available for direct investment. Index performance does not reflect transaction costs, fees or expenses.
The S&P UBS Leveraged Loan Index tracks the investable market of the U.S. dollar denominated leveraged loan market. It consists of issues rated “5B” or lower, meaning that the highest rated issues included in this index are Moody’s/S&P ratings of Baa1/BB+ or Ba1/ BBB+. All loans are funded term loans with a tenor of at least one year and are made by issuers domiciled in developed countries.
The ICE BofA U.S. High Yield Index tracks the performance of U.S. dollar denominated below investment grade corporate debt publicly issued in the U.S. domestic market. Qualifying securities must have a below investment grade rating (based on an average of Moody’s, S&P and Fitch), at least 18 months to final maturity at the time of issuance, at least one year remaining term to final maturity as of the rebalancing date, a fixed coupon schedule and a minimum amount outstanding of $250 million. In addition, qualifying securities must have risk exposure to countries that are members of the FX-G10, Western Europe or territories of the United States and Western Europe. The FX-G10 includes all Euro members, the United States, Japan, the United Kingdom, Canada, Australia, New Zealand, Switzerland, Norway, and Sweden.
AAA is the highest possible rating for a bond. Bonds rated BBB or higher are considered investment grade. BB, B, and CCC-rated bonds are considered below investment grade and carry a higher risk of default, but offer higher return potential. A split bond rating occurs when rating agencies differ in their assessment of a bond.
A basis point (bps) is a unit of measure used to describe the percentage change in the value or rate of an instrument. One basis point is equivalent to 0.01 percent.
The three-year discount margin to maturity (DMM), also referred to as discount margin, is the yield-to-refunding of a loan facility less the current three-month Libor rate, assuming a three year average life for the loan.
The interest coverage ratio is a debt and profitability ratio used to determine how easily a company can pay interest on its outstanding debt.
The leverage ratio is a metric that expresses how much of a company’s operations or assets are financed with borrowed money.
Spread is the difference in yield to a Treasury bond of comparable maturity.
Carry is the difference between the cost of financing an asset and the interest received on that asset.
EBITDA stands for earnings before interest, taxes, depreciation, and amortization.
Dry powder refers to highly liquid assets, such as cash or money market instruments, that can be invested when more attractive investment opportunities arise.
Hyperscalers are large cloud service providers that offer computing and storage at enterprise scale.
Investing involves risk, including the possible loss of principal. In general, the value of a fixed-income security falls when interest rates rise and rises when interest rates fall. Longer term bonds are more sensitive to interest rate changes and subject to greater volatility than those with shorter maturities. During periods of declining rates, the interest rates on floating rate securities generally reset downward and their value is unlikely to rise to the same extent as comparable fixed rate securities. High yield and unrated debt securities are at a greater risk of default than investment grade bonds and may be less liquid, which may increase volatility. Investors in asset-backed securities, including mortgage-backed securities and collateralized loan obligations (“CLOs”), generally receive payments that are part interest and part return of principal. These payments may vary based on the rate loans are repaid. Some asset-backed securities may have structures that make their reaction to interest rates and other factors difficult to predict, making their prices volatile and they are subject to liquidity and valuation risk. CLOs bear similar risks to investing in loans directly, such as credit, interest rate, counterparty, prepayment, liquidity, and valuation risks. Loans are often below investment grade, may be unrated, and typically offer a fixed or floating interest rate.
This article is distributed for informational or educational purposes only and should not be considered a recommendation of any particular security, strategy or investment product, or as investing advice of any kind. This article is not provided in a fiduciary capacity, may not be relied upon for or in connection with the making of investment decisions, and does not constitute a solicitation of an offer to buy or sell securities. The content contained herein is not intended to be and should not be construed as legal or tax advice and/or a legal opinion. Always consult a financial, tax and/or legal professional regarding your specific situation.
This article contains opinions of the author but not necessarily those of Guggenheim Partners or its subsidiaries. The author’s opinions are subject to change without notice. Forward-looking statements, estimates, and certain information contained herein are based upon proprietary and non-proprietary research and other sources. Information contained herein has been obtained from sources believed to be reliable, but are not assured as to accuracy. No part of this article may be reproduced in any form, or referred to in any other publication, without express written permission of Guggenheim Partners, LLC. Past performance is not indicative of future results. There is neither representation nor warranty as to the current accuracy of, nor liability for, decisions based on such information.
©2026, Guggenheim Partners, LLC. No part of this article may be reproduced in any form, or referred to in any other publication, without express written permission of Guggenheim Partners, LLC. Guggenheim Funds Distributors, LLC is an affiliate of Guggenheim Partners, LLC. For information, call 800.345.7999 or 800.820.0888.
Member FINRA/SIPC GPIM 5270224