/perspectives/sector-views/corporate-credit-quarterly-may-2026

Credit Standing Strong as AI Reshapes the Landscape
Solid corporate fundamentals continue to anchor our constructive view on credit.
Corporate Credit Quarterly
Second Quarter 2026
Corporate credit has navigated a volatile start to 2026 with resilience. A brief but sharp widening in spreads has since reversed, with markets returning to pre-war levels. The macro backdrop is more uncertain than at the start of the year and an escalation of the Iran conflict remains a meaningful risk to our outlook, but solid corporate fundamentals continue to anchor our constructive view on credit.
Beneath that resilient surface, however, divergences are taking shape. Artificial Intelligence (AI) is simultaneously supporting record issuance and earnings growth in corporate bond markets, but also accelerating credit stress in leveraged loans and private credit. Oil market disruptions are also challenging some borrowers. While default rates in floating-rate markets are likely to rise over the next 12 months, the stress should remain manageable.
Macroeconomic Update
Resilience Through the Storm
In our baseline outlook, the U.S. economy weathers the ongoing oil shock emanating from the Iran war and grows around 2 percent in 2026, supported by fiscal tailwinds, AI investment, and easy financial conditions. The economy entered the conflict with momentum, with first quarter gross domestic product growing 2.0 percent. However, the cycle of naval confrontation in the Strait of Hormuz and ceasefires quickly giving way to renewed hostilities increases uncertainty around our outlook. Our baseline assumes a gradual moderation in oil prices as negotiations continue, but a sustained closure of the Hormuz Strait remains the most significant tail risk to our forecast. With the historically large oil disruption drawing down global inventories at a rapid pace, a prolonged closure could meaningfully depress consumer spending and complicate the monetary policy response well beyond our base case. Higher tax refunds and lower tax bills under recent legislation are providing a partial cushion, helping consumers absorb elevated gasoline prices, but this offset would erode quickly if energy costs remain elevated for long.
We still expect the Federal Reserve to cut once more in the current cycle, but the timing is increasingly uncertain given recent inflationary pressures which is more likely to keep policy on hold for some time. Our view reflects an expectation that inflation will eventually resume its descent given that there are still disinflationary forces intact from wages and housing inflation. The timing of any easing will not only depend heavily on how quickly energy price pressures moderate, but also on how robust AI-related demand for scarce technology inputs, particularly semiconductors and data center components, feeds through to broader inflation. However, markets are now pricing in a high probability of rate hikes beginning in 2026, which we think is overdone.
Despite ongoing geopolitical uncertainty, markets have focused on stable economic growth and the longer-term structural implications of AI. AI capital expenditure continues to accelerate, with hyperscaler consensus expectations rising to $750 billion. At the same time, concern about AI disruption is intensifying, with dynamics now showing up in credit markets in ways that warrant close monitoring. The investment and disruption narratives are advancing in parallel, and both will be important drivers of credit performance through 2026.
Corporate Credit Review
Strong Fundamentals Are Anchoring Spreads Through Volatility
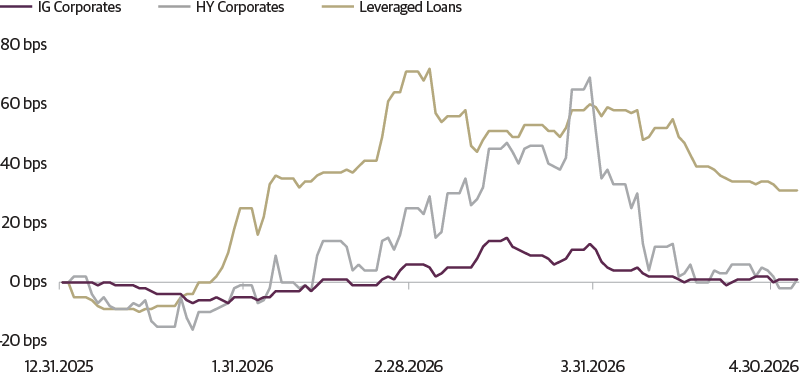
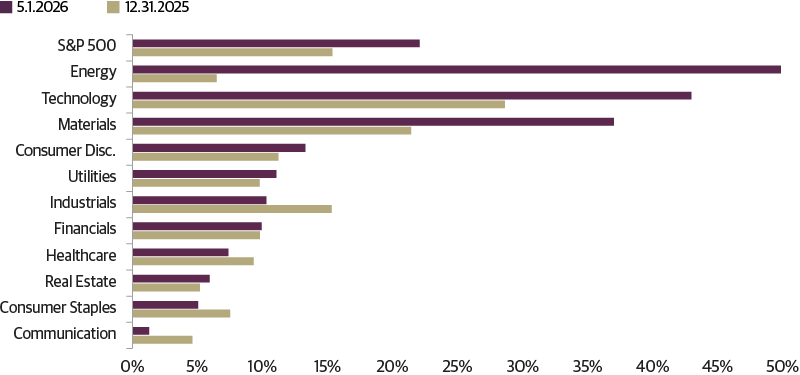
After widening sharply in response to the Iran conflict, investment-grade and high yield spreads have completed a full roundtrip back to pre-war levels, as investors refocused on healthy corporate fundamentals. Corporate earnings expectations have proven resilient through the conflict, providing a fundamental anchor for the spread recovery. First quarter earnings results not only delivered the sixth consecutive quarter of double-digit earnings per share growth for the S&P 500, but were exceptional with 26 percent growth compared to the first quarter last year. Full-year 2026 estimates have moved higher since the conflict began, now pointing to 23 percent growth over 2025. Revisions were led by energy, as analysts expect higher oil prices flow through to producer revenues, and technology, reflecting accelerating AI investment.
Corporate Credit Spreads Complete a Roundtrip to 2025 YE Levels
Change in spreads from 12.31.2025
Guggenheim Investments, Bloomberg S&P UBS. Data as of 4.29.2026
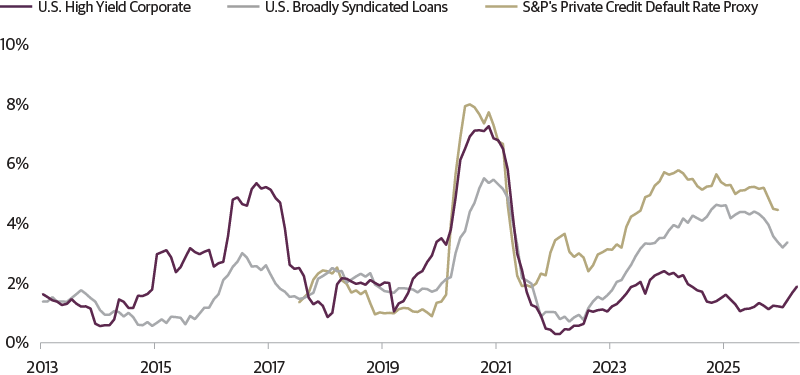
Aggregate credit quality remains healthy, with investment-grade rating migration balanced and the leveraged credit default rate near its long-run historical average of roughly 4 percent. Fallen angel activity has been limited, with the most notable downgrades in the first quarter related to a small number of special situations. The high yield market remains skewed toward higher quality BB-rated credits, as lower-quality issuers have migrated to the loan market over recent years, helping contain default rates.
S&P 500 Earnings Growth Expectations for 2026 Have Increased Through the War
Consensus EPS YoY for 2026, as of 12.31.2025 and 5.1.2026.
Source: Guggenheim Investments, FactSet. Data as of 5.1.2026.
Beneath that constructive aggregate picture, however, there are important crosscurrents worth watching. Floating-rate borrowers continue to face higher stress than fixed-rate issuers, with payment defaults and liability management exercises (LME) running roughly equal over the past twelve months. Compounding the stress is the significant concentration of leveraged loans and private credit in software and tech-enabled services—sectors directly exposed to AI disruption.
There’s a More Nuanced Picture Beneath the Surface
Default Rates including Distressed Exchanges/Selective Defaults
Source: Guggenheim Investments, S&P Global Ratings, BofA Global Research. Data as of 2.28.2026.
The Two Faces of AI in Credit Markets
The same force that is driving record issuance and earnings growth in investment grade is an accelerant of credit stress in floating-rate markets. AI investment has fueled a record start to the year for investment-grade supply, with gross issuance reaching $800 billion through the first five months of 2026, including $144 billion from technology. High yield AI- and data center-related issuance has added $20 billion and private markets another $18 billion.
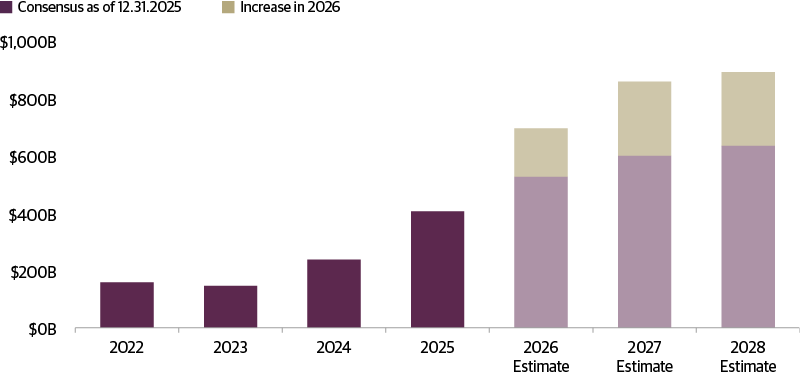
Expectations for AI-related issuance continue to rise, reflecting both stronger demand signals and higher construction and equipment costs, with hyperscaler 2026 capex consensus rising to $750 billion against $530 billion at the start of the year. As we anticipated, the record issuance year is skewing long, though we have not seen the negative impact on spreads that sometimes accompany heavy long-dated supply because all-in yields continue to look attractive to investors.
Hyperscalers Continue to Raise Capex Guidance
Analyst Expectations of Hyperscaler* Capital Expenditures
Source: Guggenheim, FactSet. Data as of 5.1.2026. Hyperscalers refer to large-scale cloud and technology companies that provide computing, storage, and networking infrastructure at massive scale. This chart reflects capital expenditure estimates for Microsoft, Amazon, Google, Meta, and Oracle.
Rapid advancement in AI capabilities has also surfaced real disruption risk. AI tools increasingly overlap with the business models of enterprise software, legal services, financial data and analytics, and payments infrastructure. The disruption played out in two phases in credit markets this year: an indiscriminate sell-off beginning in February, followed by a more discriminating period in March and April as the market began distinguishing between borrowers that are more and less exposed to the technology.
The shift is already compressing the revenue predictability and net retention dynamics that have historically supported premium software valuations, as leading providers move away from per-seat models toward usage or outcome-based fees. Many software borrowers may continue to report solid near-term results given the contracted nature of their revenues. The more consequential question is how AI uncertainty will shape valuations of future cash flows and terminal values. Distinguishing winners from losers will require a granular view of each company's competitive position, as those with deep customer integration, proprietary data, or the ability to embed AI into their own offerings are better placed to adapt.
Leveraged Loans and Private Credit Face a Compounding Stress Test
The loan market and private credit are disproportionately exposed to AI disruption given their sector concentrations, and we expect stress to push default rates higher over the next 12 months. Estimates of software exposure vary widely depending on definition, ranging from the mid-teens to nearly 30 percent, but both markets are far more concentrated in AI-disrupted sectors than high yield bonds, where software exposure sits at under 5 percent. Compounding the risk, software borrowers in these floating-rate sectors entered this period on weaker fundamental footing, carrying leverage roughly one-and-a-quarter turns above the broader loan market and interest coverage roughly half a turn below.
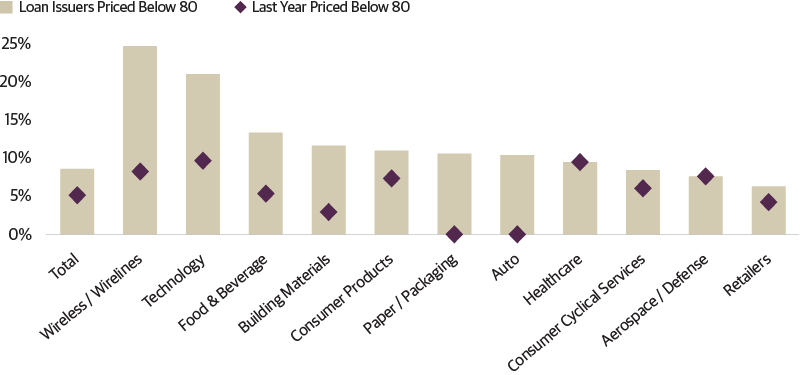
The stress is visible in loan pricing: 21 percent of technology loans trade below 80 cents on the dollar, more than double 10 percent just a year ago. Distress ratios tend to overstate realized defaults, but historical experience suggests that roughly one-third to one-half of deeply discounted loans ultimately default. At the high end of that range, if 50 percent of tech priced as distressed defaults, it would contribute roughly 2 percentage points to the overall loan default rate since tech represents around 20 percent of the index. When layered on top of default activity in other sectors, this new source of default activity could push the overall rate to 4–5 percent over the next 12 months. War-related stress is adding to that broader default pressure, with loan prices falling in food and beverage, building materials, consumer products, and paper and packaging as the Strait of Hormuz closure drives up the cost of key industrial inputs tied to plastics and food.
Broadly Syndicated Loan Pricing Reflects Expectations of Higher Stress Ahead
Loan Issuers Priced Below 80 of Par, Last Year vs. Today
Source: Guggenheim Investments, Bloomberg. Data as of 5.1.2026.
The stakes of getting credit selection wrong in broadly syndicated loans are higher than in prior cycles. Recovery rates have been trending lower over the past decade and were just 44 percent over the past 12 months, driven by weaker documentation and redefaults from prior distressed exchanges that leave issuers with thinner equity. With redefault activity now running at elevated levels (44 percent of loans that underwent liability management exercises in 2022 have defaulted again) and software stress rising, dispersion between careful credit selection and passive exposure is likely to be unusually wide.
In private credit, a similar increase in software defaults combined with stress in other vulnerable industries could push the overall default rate to 7–8 percent. This higher default rate in part reflects conversions of cash interest to payment-in-kind and amend-to-extend activity, which are counted as defaults in private credit but not in public markets. A surge of capital flowing into the asset class in recent years has weakened documentation, which may also lead to weaker recoveries.
The headlines around perpetual business development company (BDC) outflows reflect a concern about whether a wave of redemptions could force managers to sell illiquid assets at distressed prices, amplifying losses across private credit more broadly. Non-traded BDCs faced roughly $20 billion in redemption requests in the first quarter and several major managers have capped withdrawals. However, the quarterly redemption limit of 5 percent of net asset value (NAV) was designed precisely to prevent forced sales by aligning investor liquidity with the duration of underlying loan portfolios. At roughly $250 billion in assets, or about 14 percent of the direct lending market, the perpetual BDC segment is sizeable but not large enough to generate systemic pressure. We view the current dislocation as a repricing of specific exposures rather than a harbinger of broader private credit stress.
Taken together, the stress in floating-rate credit is real but manageable. The broader financial system is not showing signs of contagion and investment-grade and high yield credit remain well-supported by strong fundamentals. This looks less like the early stages of a systemic credit event and more like a sector-specific credit cycle—one that rewards careful selection.
Investment Takeaways:
- The macro backdrop remains supportive for credit, and we are constructive on the asset class overall given solid corporate fundamentals and healthy all-in yields. However, the prolonged conflict in Iran remains the primary downside risk to monitor.
- In investment grade and high yield, AI is a powerful structural force driving record issuance and earnings growth across technology and adjacent sectors. Demand continues to absorb elevated supply, and credit quality remains intact across these markets. We favor high-quality issuers with stable revenue streams and remain alert to spread curve steepening given heavy long-dated AI supply.
- In floating-rate markets, we remain selective, particularly around software exposure. Leverage remains elevated, the rate environment continues to pressure weaker borrowers, and AI disruption risk is now compounding sector-level stress in leveraged loans and private credit. Default rates are likely to move higher over the next 12 months, and the bifurcation between winners and losers within software will be significant.
- Perpetual BDC volatility is a repricing event, not a systemic signal. Redemption limits are functioning as designed and non-accruals remain low, suggesting the headlines are outpacing the underlying credit reality. Investors with longer horizons may find selective opportunities as marks adjust, particularly in vehicles trading at wide discounts to NAV.
Corporate Credit Market Performance
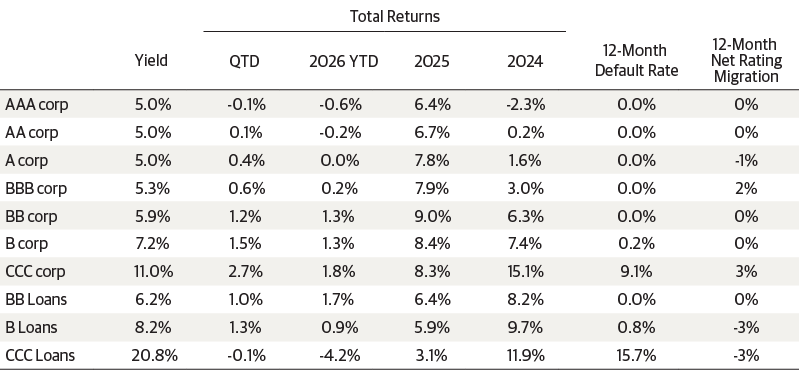
Credit has delivered solid performance over the past year, driven by coupon income, some spread compression, and modest benchmark rate declines. Credit quality pressures persist in CCC-rated debt, where default activity is concentrated. Looking ahead, investors should anticipate coupon-like returns, given our view that rates will remain rangebound and spreads could modestly widen. We expect rangebound all-in yields, with benchmark rates likely stable and spreads already tight by historical standards, leaving limited room for further compression. Although loans are starting from better valuations, we expect the sector’s default activity to remain above average which would erode some of the yield. Consequently, spread tightening is unlikely to meaningfully boost total returns, but active positioning can find strong opportunities for alpha.
Corporate Credit Performance Statistics—Yields, Total Returns, Default Rates and Net Rating Migration
.png.asp)
Source: Guggenheim Investments, Bloomberg, S&P Creditpro, S&P Dow Jones Indices, UBS. Yields and total returns as of 3.2.2026. Corporate bond yields are yield to worst, bank loan yields are 3-year yields, which assumes the loan is repaid or refinanced in 3 years. Net rating migration and default rates as both issuer-weighted and as of 1.31.2026. Net rating migration is calculated as the share of instruments in each sector rated by S&P that were upgraded minus the share of instruments that were downgraded.
Large Cap vs. Small Cap Last 12 Months Earnings per Share Year over Year %
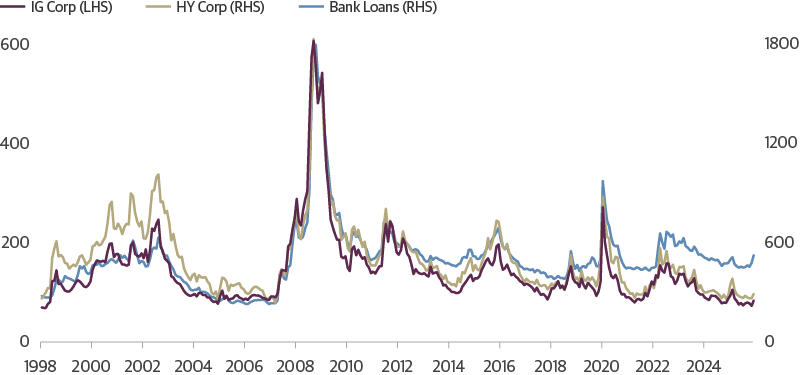
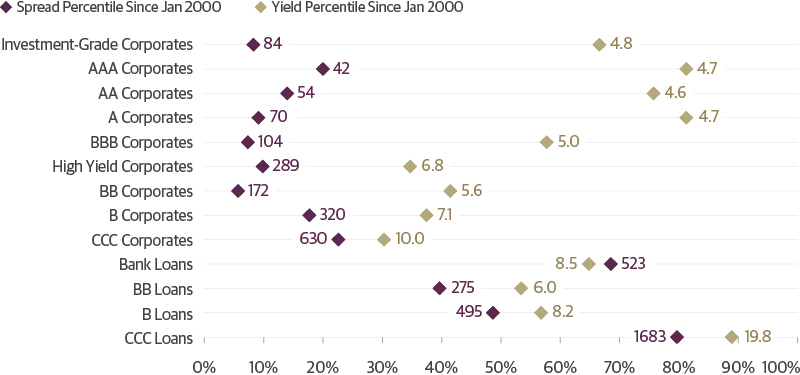
Guggenheim Investments, Bloomberg, S&P Dow Jones Indexes, UBS. Data as of 3.2.2026. Past performance does not guarantee future results.
Important Notices and Disclosures
INDEX AND OTHER DEFINITIONS
The referenced indices are unmanaged and not available for direct investment. Index performance does not reflect transaction costs, fees or expenses.
The S&P UBS Leveraged Loan Index tracks the investable market of the U.S. dollar denominated leveraged loan market. It consists of issues rated “5B” or lower, meaning that the highest rated issues included in this index are Moody’s/S&P ratings of Baa1/BB+ or Ba1/ BBB+. All loans are funded term loans with a tenor of at least one year and are made by issuers domiciled in developed countries.
The ICE BofA U.S. High Yield Index tracks the performance of U.S. dollar denominated below investment grade corporate debt publicly issued in the U.S. domestic market. Qualifying securities must have a below investment grade rating (based on an average of Moody’s, S&P and Fitch), at least 18 months to final maturity at the time of issuance, at least one year remaining term to final maturity as of the rebalancing date, a fixed coupon schedule and a minimum amount outstanding of $250 million. In addition, qualifying securities must have risk exposure to countries that are members of the FX-G10, Western Europe or territories of the United States and Western Europe. The FX-G10 includes all Euro members, the United States, Japan, the United Kingdom, Canada, Australia, New Zealand, Switzerland, Norway, and Sweden.
AAA is the highest possible rating for a bond. Bonds rated BBB or higher are considered investment grade. BB, B, and CCC-rated bonds are considered below investment grade and carry a higher risk of default, but offer higher return potential. A split bond rating occurs when rating agencies differ in their assessment of a bond.
A basis point (bps) is a unit of measure used to describe the percentage change in the value or rate of an instrument. One basis point is equivalent to 0.01 percent.
The three-year discount margin to maturity (DMM), also referred to as discount margin, is the yield-to-refunding of a loan facility less the current three-month Libor rate, assuming a three year average life for the loan.
The interest coverage ratio is a debt and profitability ratio used to determine how easily a company can pay interest on its outstanding debt.
The leverage ratio is a metric that expresses how much of a company’s operations or assets are financed with borrowed money.
Spread is the difference in yield to a Treasury bond of comparable maturity.
Carry is the difference between the cost of financing an asset and the interest received on that asset.
EBITDA stands for earnings before interest, taxes, depreciation, and amortization.
Dry powder refers to highly liquid assets, such as cash or money market instruments, that can be invested when more attractive investment opportunities arise.
Hyperscalers are large cloud service providers that offer computing and storage at enterprise scale.
Investing involves risk, including the possible loss of principal. In general, the value of a fixed-income security falls when interest rates rise and rises when interest rates fall. Longer term bonds are more sensitive to interest rate changes and subject to greater volatility than those with shorter maturities. During periods of declining rates, the interest rates on floating rate securities generally reset downward and their value is unlikely to rise to the same extent as comparable fixed rate securities. High yield and unrated debt securities are at a greater risk of default than investment grade bonds and may be less liquid, which may increase volatility. Investors in asset-backed securities, including mortgage-backed securities and collateralized loan obligations (“CLOs”), generally receive payments that are part interest and part return of principal. These payments may vary based on the rate loans are repaid. Some asset-backed securities may have structures that make their reaction to interest rates and other factors difficult to predict, making their prices volatile and they are subject to liquidity and valuation risk. CLOs bear similar risks to investing in loans directly, such as credit, interest rate, counterparty, prepayment, liquidity, and valuation risks. Loans are often below investment grade, may be unrated, and typically offer a fixed or floating interest rate.
This article is distributed for informational or educational purposes only and should not be considered a recommendation of any particular security, strategy or investment product, or as investing advice of any kind. This article is not provided in a fiduciary capacity, may not be relied upon for or in connection with the making of investment decisions, and does not constitute a solicitation of an offer to buy or sell securities. The content contained herein is not intended to be and should not be construed as legal or tax advice and/or a legal opinion. Always consult a financial, tax and/or legal professional regarding your specific situation.
This article contains opinions of the author but not necessarily those of Guggenheim Partners or its subsidiaries. The author’s opinions are subject to change without notice. Forward-looking statements, estimates, and certain information contained herein are based upon proprietary and non-proprietary research and other sources. Information contained herein has been obtained from sources believed to be reliable, but are not assured as to accuracy. No part of this article may be reproduced in any form, or referred to in any other publication, without express written permission of Guggenheim Partners, LLC. Past performance is not indicative of future results. There is neither representation nor warranty as to the current accuracy of, nor liability for, decisions based on such information.
©2026, Guggenheim Partners, LLC. No part of this article may be reproduced in any form, or referred to in any other publication, without express written permission of Guggenheim Partners, LLC. Guggenheim Funds Distributors, LLC is an affiliate of Guggenheim Partners, LLC. For information, call 800.345.7999 or 800.820.0888.
Member FINRA/SIPC GPIM 5270224
Tune in to Macro Markets to hear the top minds of Guggenheim Investments offer timely analysis on financial market trends. Guests include portfolio managers, fixed income sector heads, members of the Macroeconomic and Investment Research Group, and more.
Guggenheim Investments represents the investment management businesses of Guggenheim Partners, LLC ("Guggenheim"). Guggenheim Funds Distributors, LLC is an affiliate of Guggenheim.
Read a prospectus and summary prospectus (if available) carefully before investing. It contains the investment objective, risks charges, expenses and the other information, which should be considered carefully before investing. To obtain a prospectus and summary prospectus (if available) click here or call 800.820.0888.
Investing involves risk, including the possible loss of principal.
Guggenheim Investments represents the following affiliated investment management businesses of Guggenheim Partners, LLC: Guggenheim Partners Investment Management, LLC, Security Investors, LLC, Guggenheim Funds Distributors, LLC, Guggenheim Funds Investment Advisors, LLC, Guggenheim Corporate Funding, LLC, Guggenheim Wealth Solutions, LLC, Guggenheim Private Investments, LLC, Guggenheim Investments Loan Advisors, LLC, Guggenheim Partners Europe Limited, Guggenheim Partners Japan Limited, and GS GAMMA Advisors, LLC.
This is not an offer to sell nor a solicitation of an offer to buy the securities herein. GCIF 2019 and GCIF 2016 T are closed for new investments.
©
Guggenheim Investments. All rights reserved.
Research our firm with FINRA Broker Check.
Not FDIC Insured • No Bank Guarantee • May Lose Value
This website is directed to and intended for use by citizens or residents of the United States of America only. The material provided on this website is not intended as a recommendation or as investment advice of any kind, including in connection with rollovers, transfers, and distributions. Such material is not provided in a fiduciary capacity, may not be relied upon for or in connection with the making of investment decisions, and does not constitute a solicitation of an offer to buy or sell securities. All content has been provided for informational or educational purposes only and is not intended to be and should not be construed as legal or tax advice and/or a legal opinion. Always consult a financial, tax and/or legal professional regarding your specific situation. Investing involves risk, including the possible loss of principal.
By choosing an option below, the next time you return to the site, your home page will automatically
be set to this site. You can change your preference at any time.
We have saved your site preference as
Institutional Investors. To change this, update your
preferences.
United States Important Legal Information
By confirming below that you are an Institutional Investor, you will gain access to information on this website (the “Website”) that is intended exclusively for Institutional Investors and, as such, the information should not be relied upon by individual investors. This Website and any product, content, information, tools or services provided or available through the Website (collectively, the “Services”) are provided to Institutional Investors for informational purposes only and do not constitute a recommendation to buy or sell any security or fund interest. Nothing on the Website shall be considered a solicitation for the offering of any investment product or service to any person in any jurisdiction where such solicitation or offering may not lawfully be made. By accessing this Website, you expressly acknowledge and agree that the Website and the Services provided on or through the Website are provided on an as is/as available basis, and except as partnered by law, neither Guggenheim Investments and it parents, subsidiaries and affiliates nor any third party has any responsibility to maintain the website or the Services offered on or through the Website or to supply corrections or updates for the same. You understand that the information provided on this Website is not intended to provide, and should not be relied upon for, tax, legal, accounting or investment advice. You also agree that the terms provided herein with respect to the access and use of the Website are supplemental to and shall not void or modify the Terms of Use in effect for the Website. The information on this Website is solely intended for use by Institutional Investors as defined below: banks, savings and loan associations, insurance companies, and registered investment companies; registered investment advisers; individual investors and other entities with total assets of at least $50 million; governmental entities; employee benefit (retirement) plans, or multiple employee benefit plans offered to employees of the same employer, that in the aggregate have at least 100 participants, but does not include any participant of such plans; member firms or registered person of such a member; or person(s) acting solely on behalf of any such Institutional Investor.
By clicking the "I confirm" information link the user agrees that: “I have read the terms detailed and confirm that I am an Institutional Investor and that I wish to proceed.”