Executive Summary
- Recent legislation may make liability driven investing (“LDI”) unattractive for some U.S. based pension plans.
- Traditional “core” fixed income strategies will likely struggle to deliver returns that improve or even maintain a plan’s funded status.
- We believe plan sponsors can more effectively manage risk and improve funded status through fixed income strategies that deliver higher total return by investing across a wider range of securities.
LDI—Is Now the Time to Adopt?
The term “liability driven investing” (LDI) can mean different things to different people. All interpretations have one thing in common: they connote a strategy of managing and reducing the financial risk that comes with sponsoring a pension plan. For the purpose of this paper, we use the term LDI to mean a strategy where a pension plan invests its fixed income assets in long-duration bonds in order to create a hedge against the interest rate sensitivity of its long-duration liabilities. Broader definitions of LDI include “glide path” strategies that are generally applicable to underfunded plans. These glide path strategies initially invest fixed income assets in accordance with a benchmark that has a considerably shorter duration, such as the Barclays U.S. Aggregate Index. As funded status improves, duration is extended and the allocation to fixed income typically increases.
The universe of corporate pension plans can be divided into two groups:
- Pension plans that are underfunded on a mark-to-market basis
- Pension plans that are fully funded on a mark-to-market basis
For an underfunded plan in the first group - especially one whose sponsor is sensitive to managing ERISA minimum required contributions—recent legislation has created an environment where “hedging” with an LDI strategy actually creates added risk in the near-term1. In this case, it may be advisable to defer extending fixed income duration, and in addition, consider employing as part of a “glide path” a fixed income strategy designed to improve the plan’s funded status more rapidly than a traditional “core” fixed income strategy. This paper will focus on the group of plans which are underfunded on a mark-to-market basis.
In contrast, for a fully funded plan in the second group, LDI remains an extremely effective risk management strategy. Sponsors of fully funded plans are not required to contribute to the plan (and are not affected by the legislation) and there is little or no incentive to take on investment risk to improve funded status. Rather, the primary objective generally would be to ensure that the plan remains fully funded on a mark-to-market basis. In this situation, LDI remains an attractive strategy, and one that we plan to discuss further in a future paper.
Related Terminology
Before continuing our discussion, we want to define several terms that we’re going to use in the remainder of this paper. These are not “terms of art,” but will be useful in explaining key concepts.
- ERISA Discount Rates: The rates used to value ERISA liabilities for minimum funding purposes, as specified in recent legislation
- ERISA Plan Liabilities: The value of liabilities used to determine a plan’s minimum annual required contributions
- ERISA Funding Ratio: The funded status of a plan using the value of plan liabilities and assets for ERISA minimum funding purposes
Implications of Recent Pension Legislation
On August 8, 2014, President Obama signed the Highway and Transportation Funding Act of 2014 (HATFA), extending funding of the Highway Trust Fund. This legislation was financed by including a “pension smoothing” provision that extended provisions originally enacted in 2012’s Moving Ahead for Progress in the 21st Century Act (MAP-21). This provision allows plan sponsors to take into account 25-year averages of interest rates when valuing ERISA liabilities in order to reduce the volatility of minimum annual contributions, an approach that is consistent with the long-term nature of pension financing2. Since MAP-21 was enacted in 2012, minimum required contributions have been lower than they would otherwise have been in the current low interest rate environment. Interest rates have been on a steady downward trend since the mid-1980s, so the 25-year average of rates is substantially higher than current rates. Using these higher discount rates to calculate the present value of their liabilities, pension plans that are only 80-85% funded on a mark-to-market basis can appear to be fully funded on an ERISA basis, resulting in lower minimum required contributions.
Exhibit 1: The Evolution of Interest Rates from 1988 - 2014
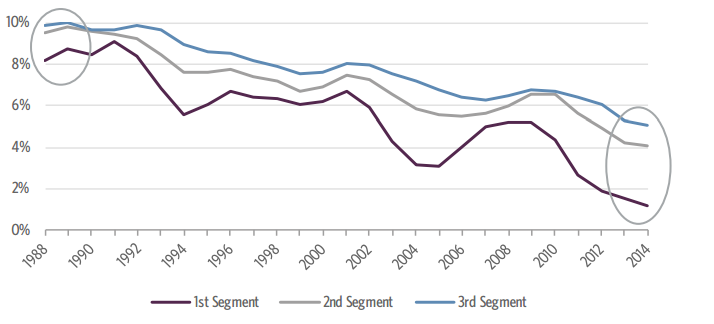
Source: Guggenheim Investments, Internal Revenue Service. Interest rates shown are the annual averages of 24-Month Segment Rates, which are used to develop the 25-year average under MAP-21 and HATFA. Segment rates refer to the rates that pension plans use to discount their plan liabilities under the Pension Protection Act of 2006. The interest rates are published by the US Treasury and derived from high-grade corporate bond yield curves. The first segment covers benefits payable in less than 5 years, the second segment covers benefits payable 5 to 20 years out, and the third segment covers benefits to be paid more than 20 years from now.
The outcome of LDI will be the potential need for larger cash contributions to the pension fund or, alternatively, better returns on the underlying assets.
Over the next several years, the 25-year average of interest rates will almost certainly decline further. The high interest rates of the late 1980s and early 1990s will drop out of the calculation and, unless current market interest rates rise by several hundred basis points, be replaced by lower rates going forward. As a result, the ERISA discount rates will continue to decline (with a corresponding increase in ERISA plan liabilities), even if current interest rates increase moderately3. That said, the 25-year average rates will still remain higher than market rates, and plan sponsors will continue to benefit from lower minimum required contributions.
So far, so good — but there is a downside to this legislation, particularly for plans using an LDI strategy. If interest rates increase gradually as the market currently expects, the value of a pension fund’s fixed income assets may fall without an offsetting decline in the value of its ERISA plan liabilities. In effect, MAP-21 and HATFA generate an “effective regulatory duration” near zero for ERISA plan liabilities, as movements in current market interest rates have very little impact on ERISA discount rates, and consequently, on ERISA plan liabilities. Meanwhile, the relationship between market interest rates and the value of a plan’s fixed income assets continues to apply. While LDI may provide a hedge on a mark-tomarket basis, it provides anything but that for plans that will use ERISA discount rates4. The outcome of LDI will be the potential need for larger cash contributions to the pension fund or, alternatively, better returns on the underlying assets.
Below we illustrate the potential change in a hypothetical plan’s ERISA funding ratio over the next year with a simplified example. We assume the plan is 100% funded on an ERISA basis in 2014 (as previously mentioned, this equates to about 80-85% funded on a mark-to-market basis), and has all of its assets invested in fixed income with a duration of 12 years, corresponding to the duration of its liabilities on a mark-to-market basis.
Exhibit 2: Changes to a Hypothetical Plan’s ERISA Funded Status Under Different 2015 Interest Rate Scenarios5
| |
|
Change in Value of ERISA Plan Liabilities |
Change in Value of Plan Assets |
|
(A)
2014 ERISA
Funding Ratio |
Change in
Market Interest
Rates |
(B)
Impact of 1-Year
Update in 25-Year
Average Rates6 |
(C)
Impact of Market
Rate Movement |
(D)
Impact of Market
Rate Movement |
(A - B - C + D) 2015 ERISA Funding Ratio |
| 100% |
Increase 100bps |
+2% |
+0% |
-12% |
86% |
| 100% |
Increase 50bps |
+2% |
+0% |
-6% |
92% |
| 100% |
No shift |
+2% |
+0% |
0% |
98% |
| 100% |
Decrease 50 bps |
+2% |
+0% |
+6% |
104% |
A true hedge would result in the same 2015 ERISA funding ratio regardless of interest rate movements, which clearly is not the case. In fact, as a result of the smoothing mechanisms in MAP-21 and HATFA, the ERISA plan funding ratio actually decreases in the base case assumption with interest rates unchanged. Bottom line: an LDI hedge actually creates minimum funding requirement risk.
Conclusion
There is a Better Way to Manage Risk and Improve Plan Funded Status
Against the current regulatory and interest rate backdrop, we question whether traditional LDI duration matching strategies are suitable for sponsors of underfunded plans who are concerned about managing their ERISA contribution requirements. In addition, for those pension plans that have not yet adopted LDI, relying on low-yielding “core” fixed income strategies will make it difficult to achieve returns that improve or even maintain their funded status. So what is a plan sponsor to do?
We believe that pension plan sponsors should move away from traditional core fixed income approaches and embrace a broader investment framework, incorporating a wider range of securities in their investable universe and more actively assessing relative value opportunities. By shifting allocations towards the sectors and securities that offer the best total return profiles, opportunities exist to increase returns without extending duration at a time when extending duration doesn’t truly provide a hedge. With the near-term challenges that LDI strategies will likely face, we believe this variation on the traditional approach is a more viable solution to manage a pension plan’s risk exposure and ultimately improve its funded status.
The Expertise of Guggenheim Investments
Guggenheim Investments manages $132 billion in fixed income, including more than $90 billion in core and core plus fixed income mandates. Performing rigorous bottom-up research across the full spectrum of the fixed income market enables us to deliver portfolios that meet our clients’ total return objectives without assuming unnecessary credit or duration risk. From off-the-run corporate credit to complex, underfollowed asset-backed securities, we cast a wider net than generic market indices to uncover value. Our portfolios are constructed to reflect Guggenheim’s extensive macroeconomic and relative value analysis, which has helped us successfully navigate client portfolios through the 2008 sub-prime crisis, multiple rounds of quantitative easing and Fed-induced volatility generated by speculation over tapering.
Our innovative investment approach has delivered strong absolute and risk-adjusted returns since inception and outperformed many traditional core and core plus strategies that tend to closely track the low-yielding Barclays U.S. Aggregate Index. With our strong performance track record, unique expertise and objectives-based approach to portfolio construction, we can partner with plan sponsors to deliver investment solutions that improve their funded status and manage risk in this challenging market and regulatory environment.
Appendix
Part A. The Different Regulatory Methods for Determining a Plan’s Minimum Required Contributions
Beginning with the enactment of the Pension Protection Act of 2006 (PPA), pension plans have had the option to use three 24-month average interest rates, known as “segment rates,” as the discount rates for their plan liabilities. The interest rates are published by the US Treasury and derived from high-grade corporate bond yield curves. The first segment covers benefits payable in less than 5 years, the second segment covers benefits payable 5 to 20 years out, and the third segment covers benefits to be paid more than 20 years from now.
As interest rates decreased in the aftermath of the financial crisis, the 24-month averages of the segment rates trended downward as well, increasing the value of ERISA plan liabilities and resulting in increased minimum required contributions. In 2012, Congress passed the Moving Ahead for Progress in the 21st Century Act (MAP-21) to provide funding relief, incorporating a long-term average of the segment rates into the calculation. Under MAP-21, the 24-month average rate was initially constrained to a 10% range around the 25-year average of the segment rate, with this percentage band set to increase in width over time beginning the following year.
Last month’s Highway and Transportation Funding Act (HATFA) delays the expansion of the corridor around the 25-year average segment rate. The 24-month average rates will continue to be subjected to the same 10% range around the 25-year average of the segment rates through 2017. With the 24-month average rates currently falling below this corridor, HATFA’s tightening of the corridor results in higher segment rates for plan liability discounting.
Corridor around 25-Year Average Segment Rate in Future Plan Years
| Plan Year |
MAP-21 |
HATFA |
| 2014 |
80% to 120% |
90% to 110% |
| 2015 |
75% to 125% |
90% to 110% |
| 2016 |
70% to 130% |
90% to 110% |
| 2017 |
70% to 130% |
90% to 110% |
| 2018 |
70% to 130% |
90% to 110% |
The table below shows hypothetical segment rates for July 2014 using each of the three methodologies.
| |
PPA |
MAP-21 |
HATFA (current) |
| First Segment |
1.14 |
4.43 |
4.99 |
| Second Segment |
4.04 |
5.62 |
6.32 |
| Third Segment |
5.11 |
6.21 |
6.99 |
Part B. Future Segment Discount Rates Under Various Interest Rate Scenarios
MAP-21 and HATFA both utilize smoothing mechanisms to dampen the impact of market interest rate movements on the valuation of ERISA pension liabilities. In practice, this means that the future path of ERISA discount rates over the next several years is already largely set, with future market interest rate movements having only a minimal impact. To illustrate, the table below shows the segment rates that would be in effect over the next three years, assuming an instantaneous and parallel shock to the market yield curve in August 2014.
| |
First Segment |
Second Segment |
Third Segment |
| Curve Shock |
None |
+50 bps |
+ 100 bps |
+50 bps |
None |
+100 bps |
None |
+50 bps |
+ 100 bps |
| Plan Year 2015 |
4.72% |
4.72% |
4.72% |
6.11% |
6.11% |
6.11% |
6.81% |
6.81% |
6.81% |
| Plan Year 2016 |
4.43% |
4.43% |
4.44% |
5.92% |
5.92% |
5.93% |
6.65% |
6.66% |
6.66% |
| Plan Year 2017 |
4.15% |
4.17% |
4.19% |
5.72% |
5.74% |
5.76% |
6.49% |
6.51% |
6.53% |